![]()
![]()
Simplify the creation of your data visualizations with the
{unhcrthemes} R package. It is designed to align your plots
with UNHCR’s data
visualization recommendations. This package offers a comprehensive
{ggplot2} theme, including built-in customizations and
thoughtfully crafted color palettes.
{ggplot2} theme that matches
UNHCR Data Visualization
Guidelines.{ggplot2} plots.Get started by installing the {unhcrthemes} package from
CRAN with:
install.packages("unhcrthemes")Or retrieve the development version from Github using the
{pak} package:
# If pak is not yet installed, uncomment the following line:
# install.packages("pak")

pak::pkg_install("unhcr-dataviz/unhcrthemes")# Load required packages
library(ggplot2)
library(unhcrthemes){ggplot2} theme# Apply the theme_unhcr() to your plot
ggplot(
mtcars,
aes(x = hp, y = mpg)
) +
geom_point() +
labs(
title = "Simple scatterplot with ggplot",
subtitle = "This plot shows the default style of theme_unhcr()",
x = "Horsepower (hp)",
y = "Fuel efficiency (mpg)",
caption = "Source: mtcars"
) +
theme_unhcr()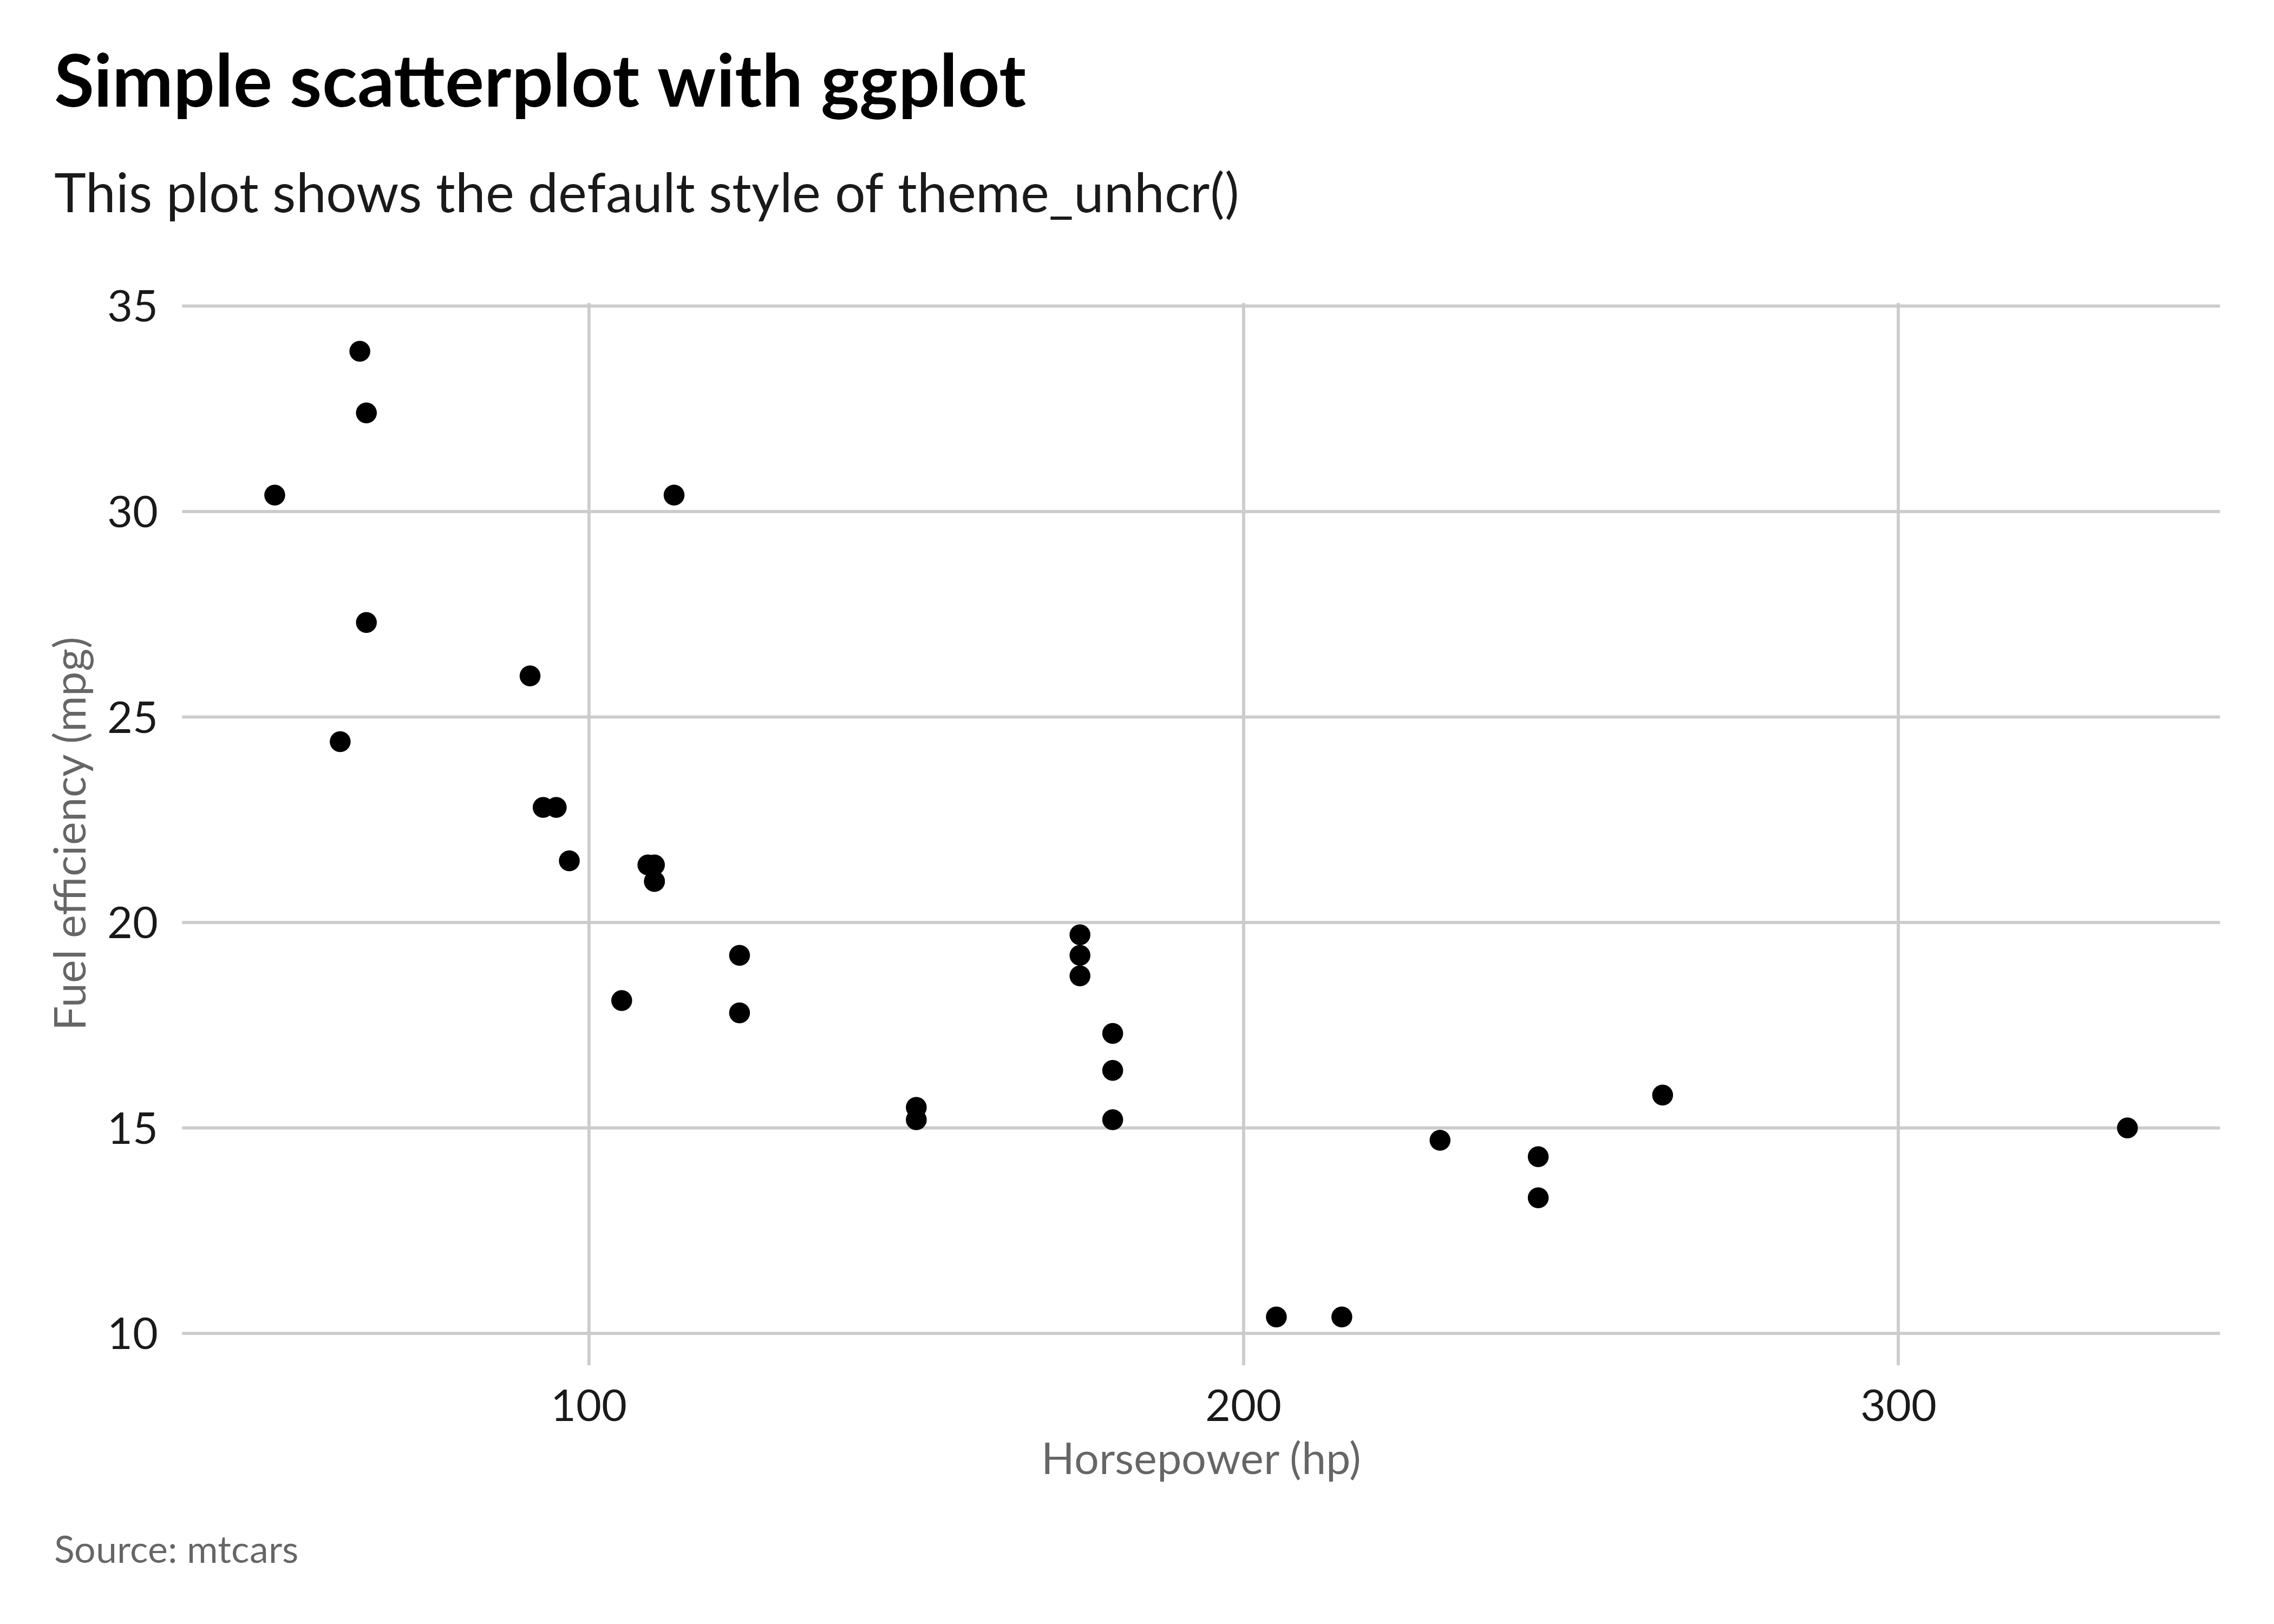
One of the two officially recommended fonts outlined in the UNHCR Data Visualization
Guidelines is Lato. To
ensure optimal functionality of the {unhcrthemes} package,
please make sure that the Lato font is installed on your
device prior to usage.
For R PDF (pdf) and PostScript
(postcript) devices, there is a function
import_lato that can be used to import the
Lato font into these two devices. We recommend the use of
cairo_pdf or cairo_ps devices, which work when
you have Lato installed. They are available on all
platforms and have better support custom fonts.
Choose from a variety of carefully curated color palettes that harmonize with UNHCR’s visual identity.
# Display all unhcr color palette
display_unhcr_all()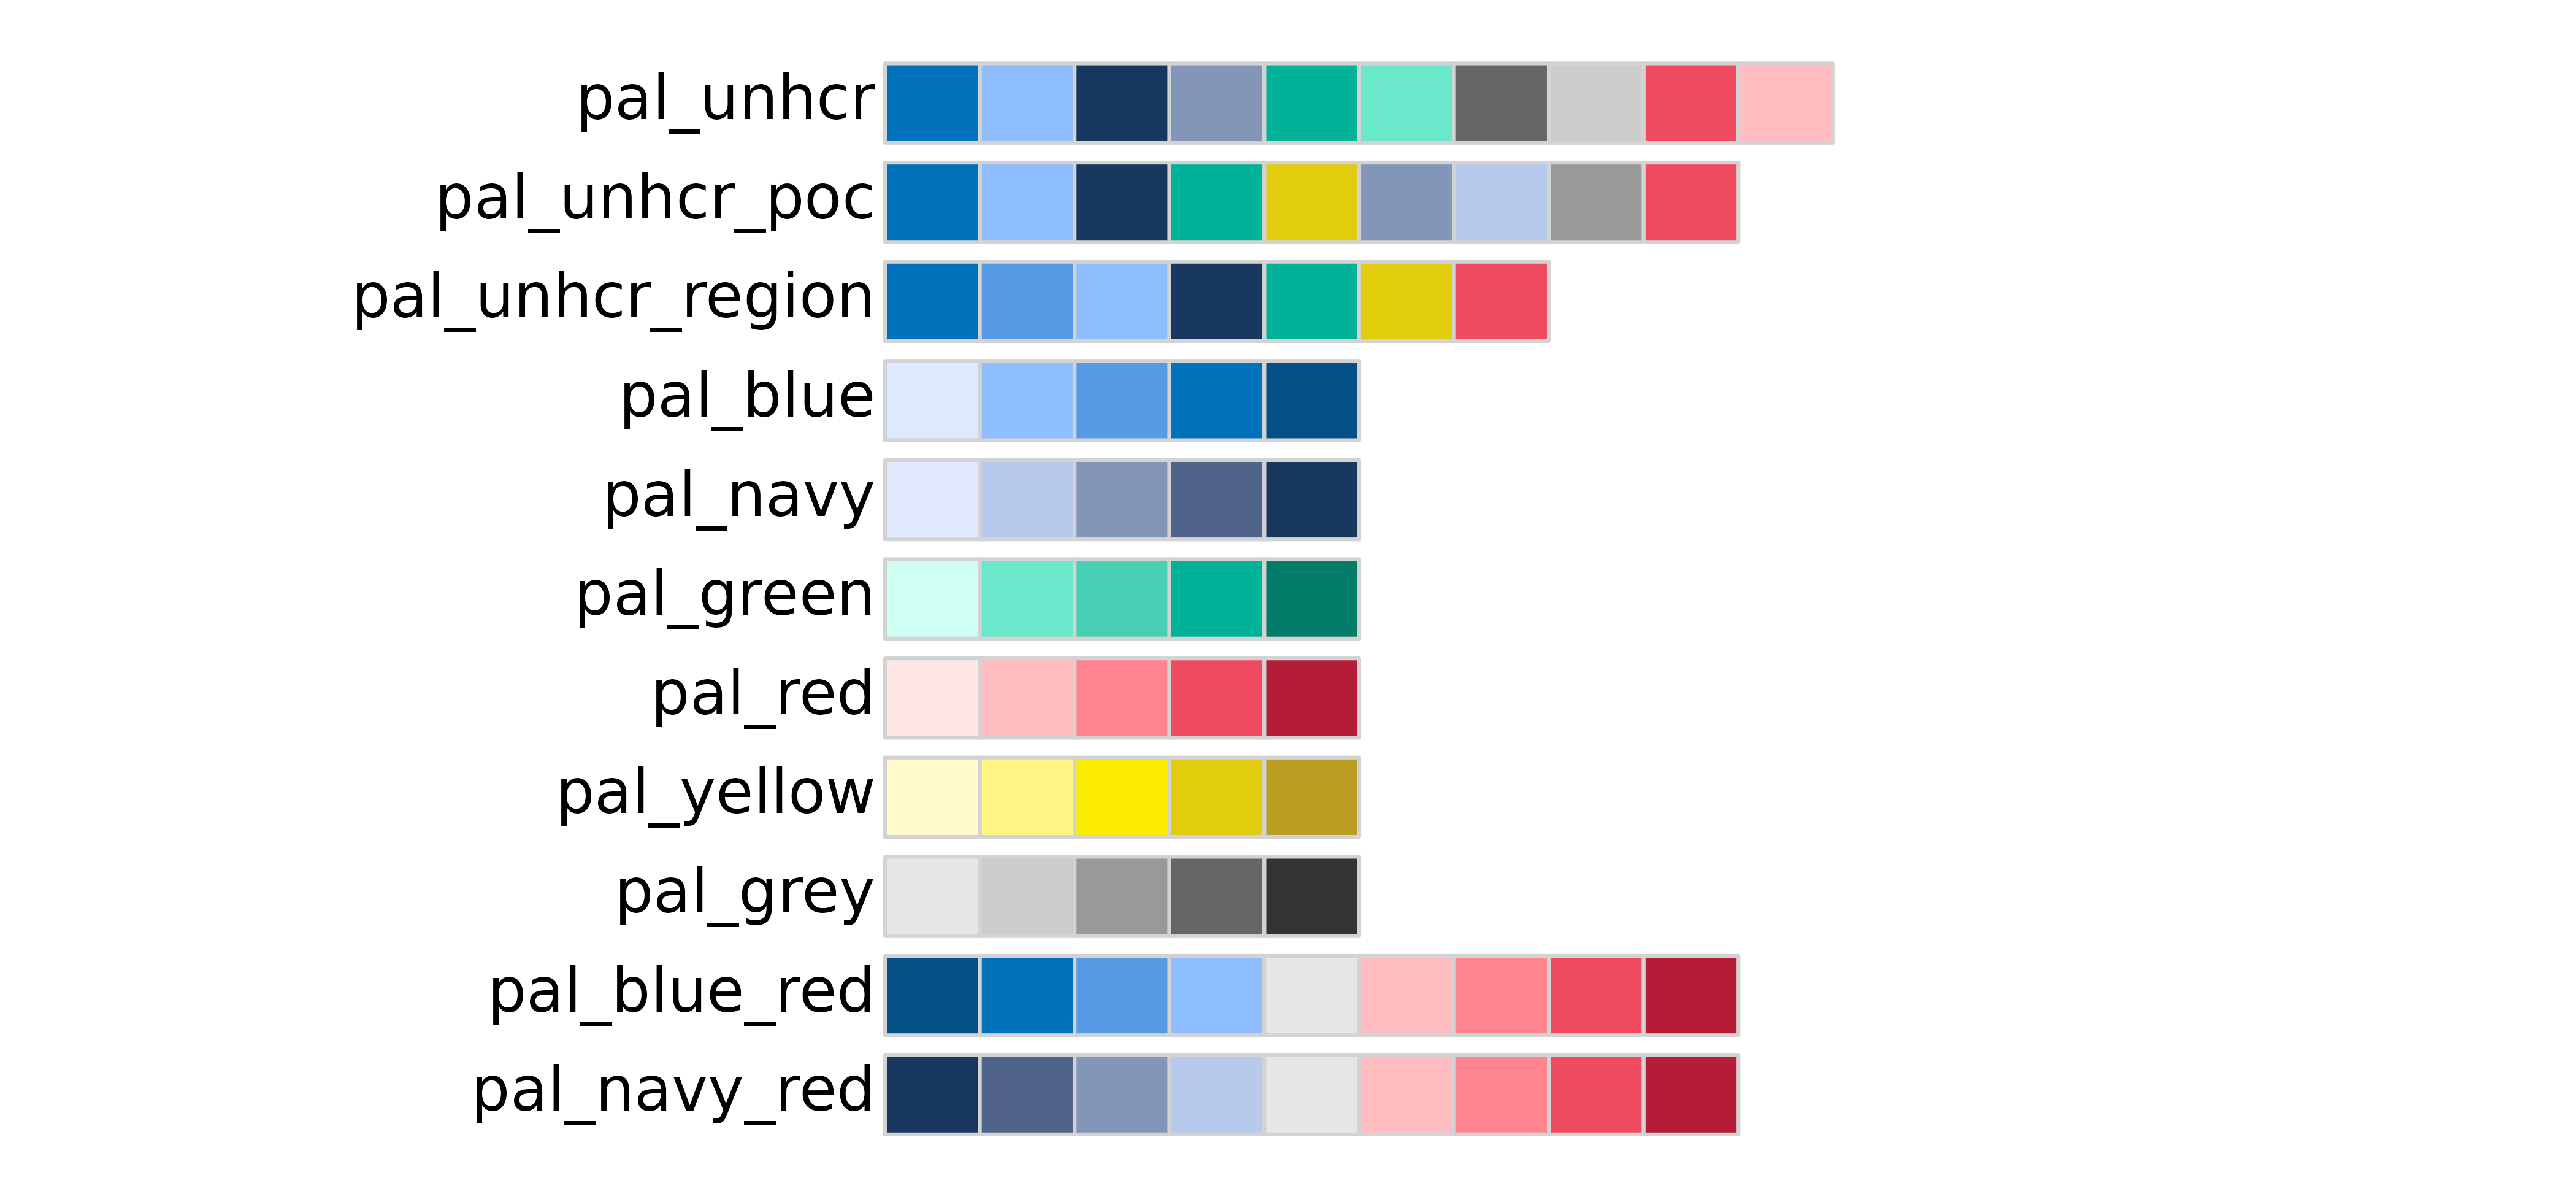
# Or select a specific one and limit the number of colors
display_unhcr_pal(n = 3, "pal_blue")
# Add color scale to your plot
ggplot(
  mtcars,
  aes(x = hp, y = mpg, color = as.factor(cyl))
) +
  geom_point(alpha = .8) +
  labs(
    title = "Simple scatterplot with ggplot",
    subtitle = "This plot shows the default style of theme_unhcr()",
    x = "Horsepower (hp)",
    y = "Fuel efficiency (mpg)",
    color = "Number of cylinder",
    caption = "Source: mtcars"
  ) +
  scale_color_unhcr_d() +
  theme_unhcr(legend_title = TRUE)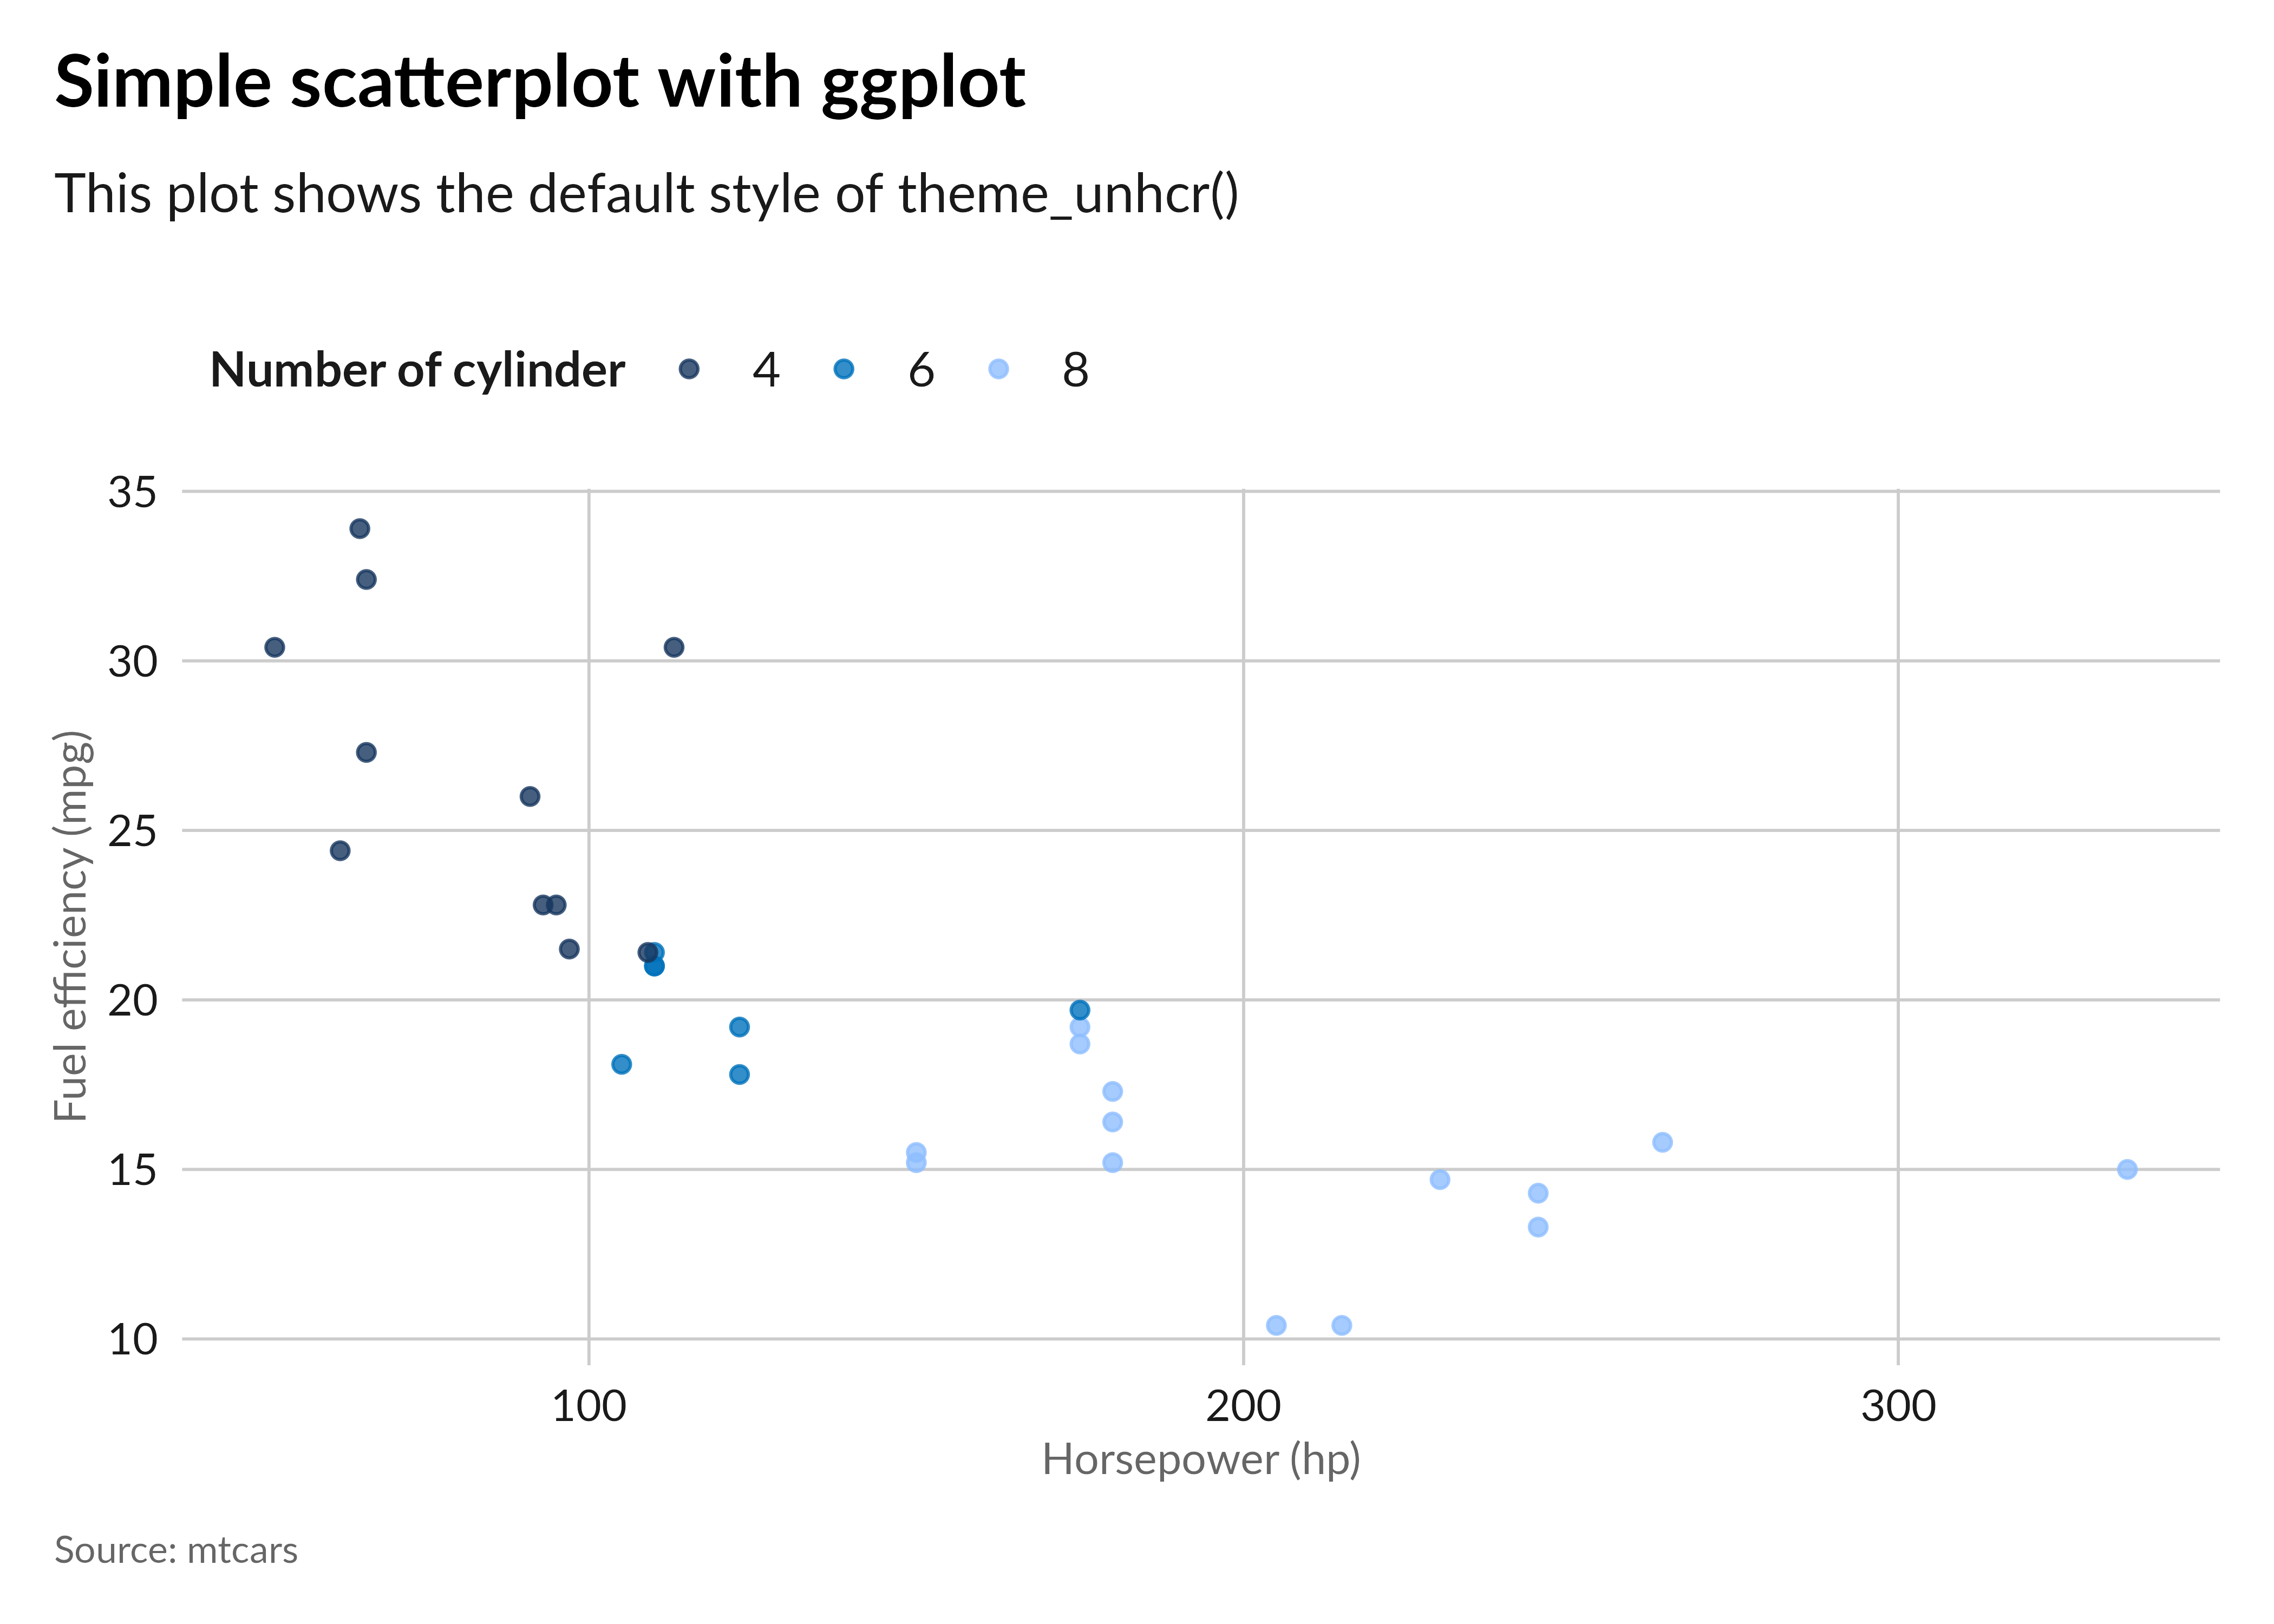
# Default Lato font also apply for geom_text and label
dplyr::count(mpg, class) |>
  dplyr::arrange(n) |>
  dplyr::mutate(class = factor(class, levels = class)) |>
  ggplot(aes(n, class)) +
  geom_col(fill = unhcr_pal(n = 1, "pal_blue")) +
  geom_text(aes(label = n), hjust = 0, nudge_x = 1) +
  labs(
    title = "Simple bar chart with labels using ggplot",
    subtitle = "This plot shows the default style of theme_unhcr()",
    caption = "Source: mtcars"
  ) +
  scale_x_continuous(expand = expansion(c(0, 0.1))) +
  theme_unhcr(grid = FALSE, axis = "y", axis_title = FALSE, axis_text = "y")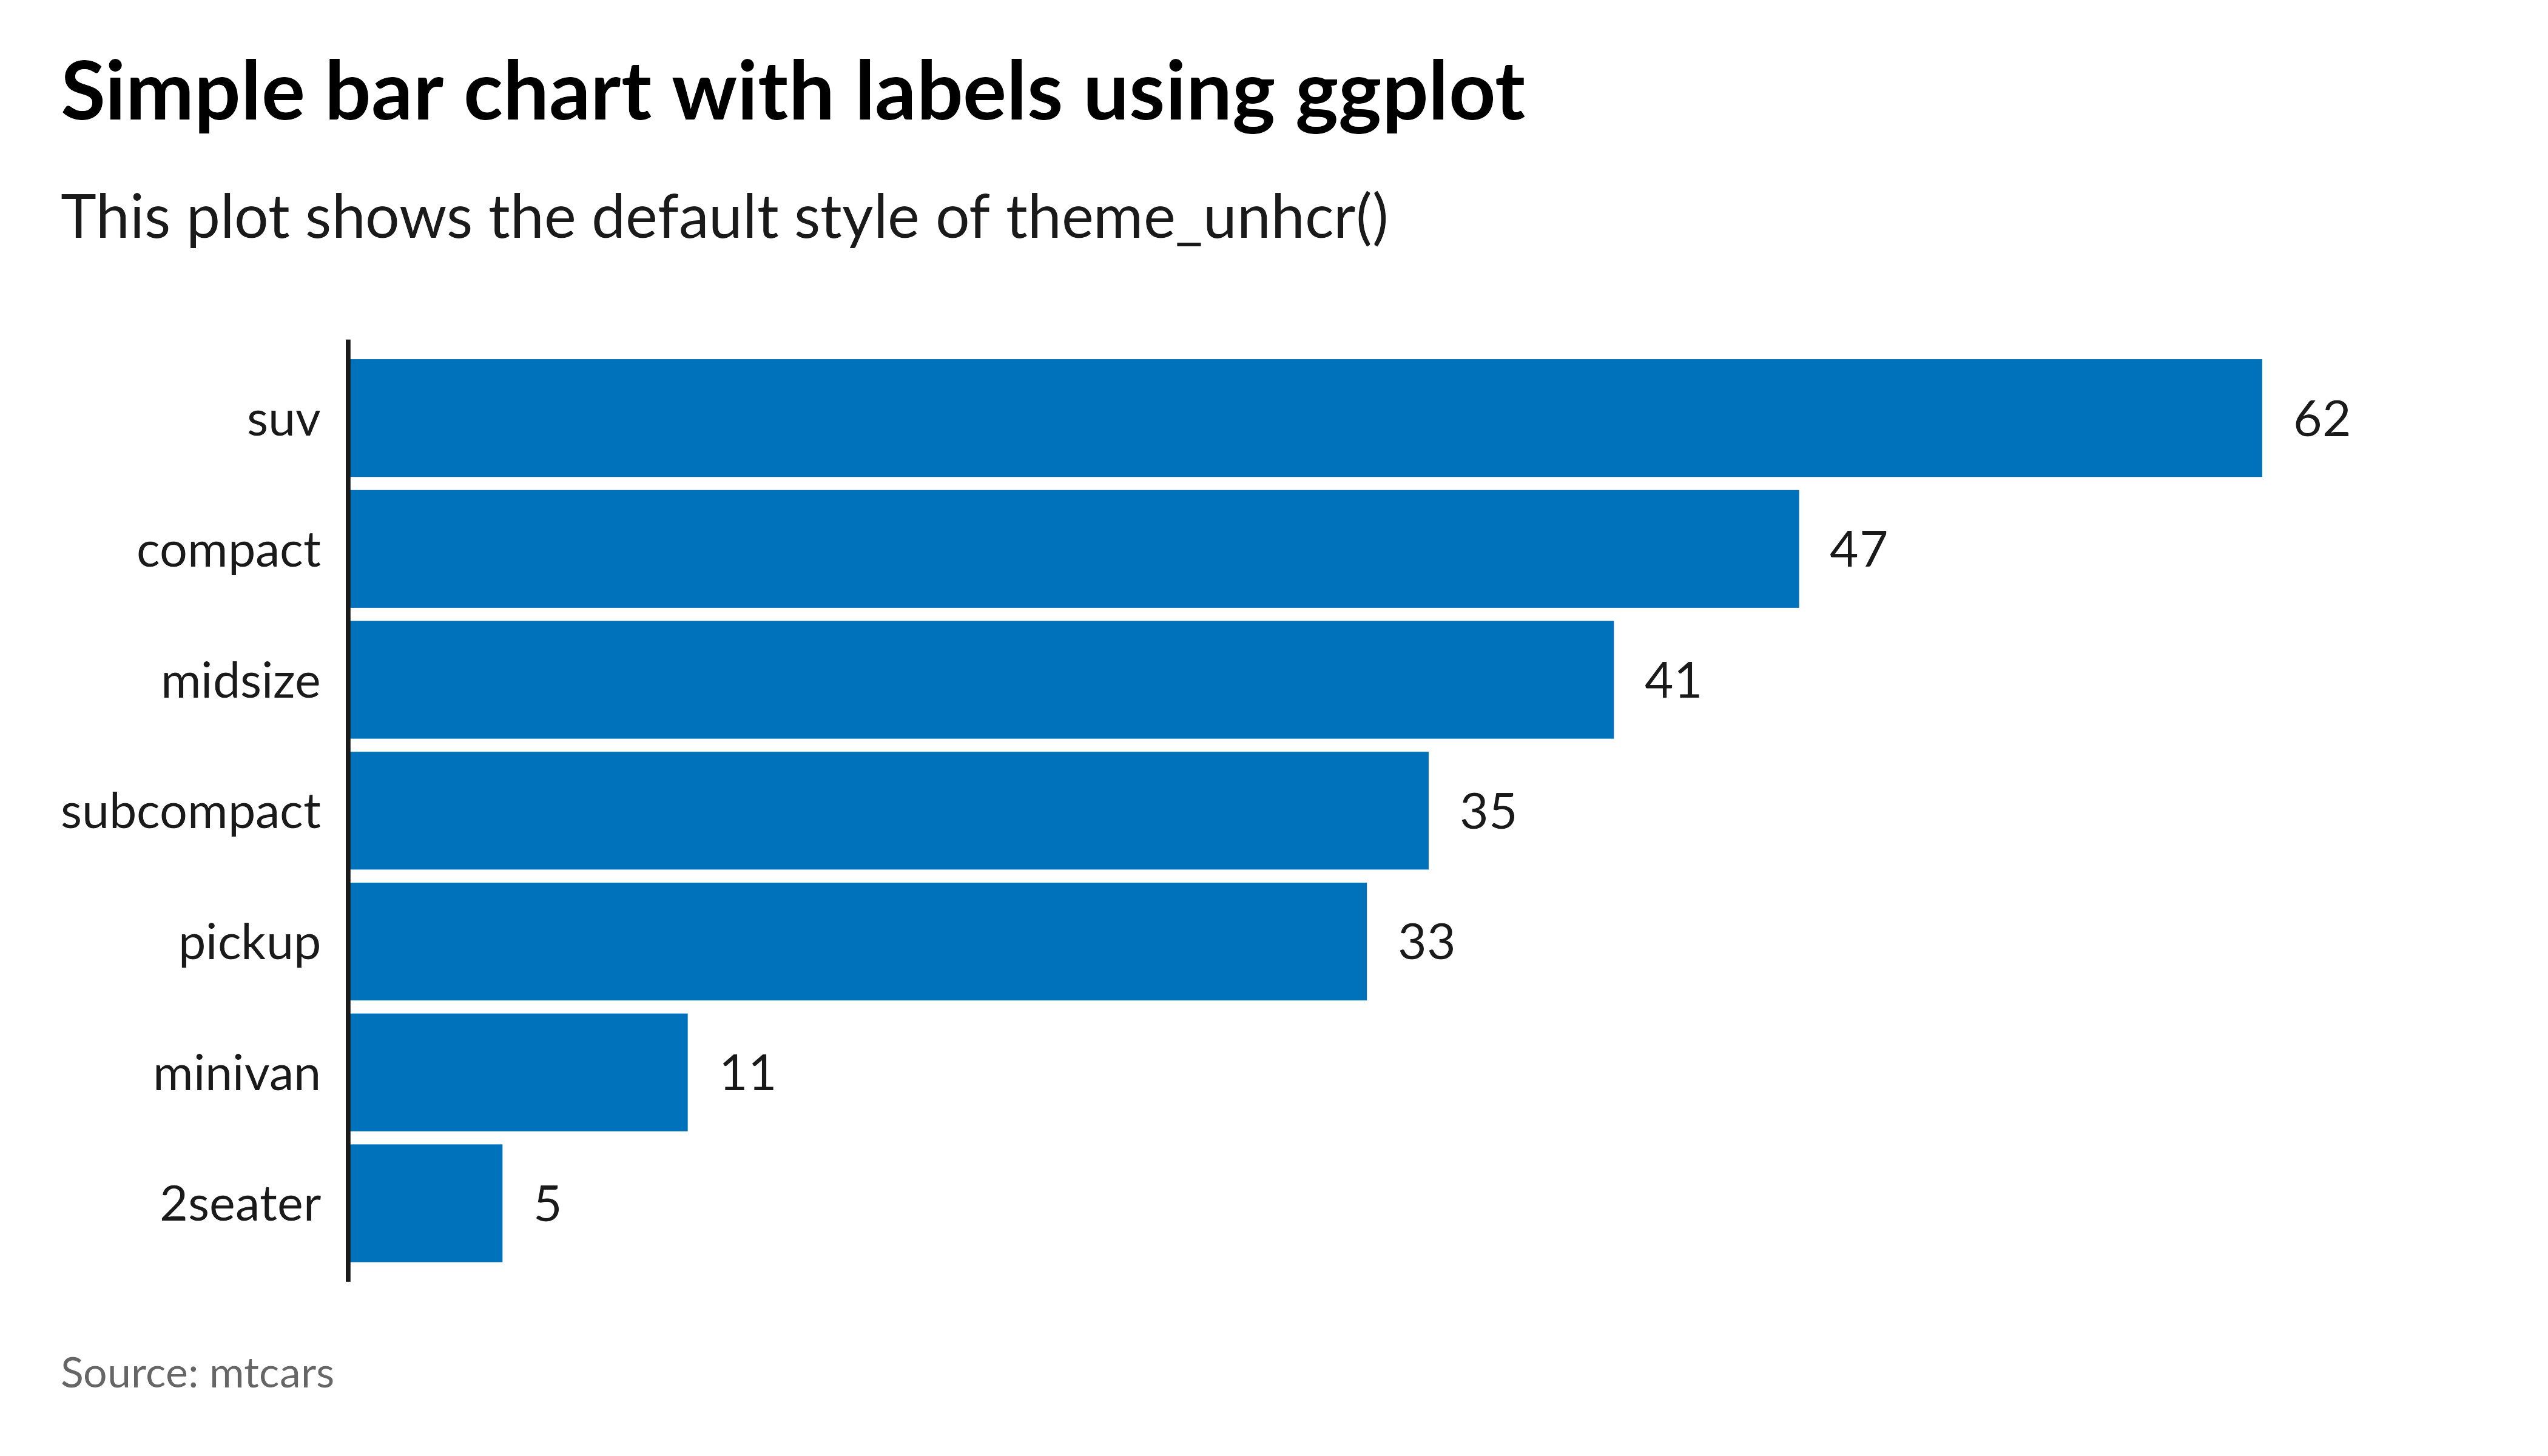
Explore more examples of {unhcrthemes} in action on the
package
vignette or UNHCR
Data Visualization Platform.
We extend our gratitude to the creators of the {hrbrthemes},
{rcartocolor}
and {cowplot}
packages that influenced the development of
{unhcrthemes}.
Contributions to {unhcrthemes} are highly valued. To
ensure a welcoming and inclusive community, we follow our Contributor
Code of Conduct. If you have suggestions, uncover bugs, or envision
new features, kindly submit an issue on
GitHub. To contribute code, don’t hesitate to fork the repository
and create a pull request.
This package is distributed under the MIT License.