The goal of ibdfindr is to detect genomic regions
shared identical by descent (IBD) between two individuals,
using SNP genotypes or genotype likelihoods. It fits continuous-time
hidden Markov models (HMMs) with two- and three-state models for
different relationship types. The main function findIBD()
provides a unified workflow.
ibdfindr was introduced in Vigeland et al. (2026), where it was applied to identify a victim of the 1956 Marcinelle mining disaster in Belgium.
To get the latest official release of ibdfindr, install from CRAN as follows:
install.packages("ibdfindr")For the development version, install from GitHub:
remotes::install_github("magnusdv/ibdfindr")library(ibdfindr)As an example we consider the built-in dataset
cousinsDemo, which contains almost 4000 SNP genotypes for
two related individuals. The data were simulated assuming a relationship
of first cousins. (For details on how the data was generated, the source
code is available in the repository’s folder data-raw.)
head(cousinsDemo)#> CHROM MARKER MB CM A1 A2 FREQ1 ID1 ID2
#> 1 1 rs9442372 1.083324 0.0000000 A G 0.3890 A/G G/G
#> 2 1 rs4648727 1.844830 0.1803812 A C 0.3628 A/C A/C
#> 3 1 rs10910082 2.487496 1.2670505 C T 0.3740 C/T C/T
#> 4 1 rs6695131 3.084360 1.9782286 C T 0.5719 C/T C/T
#> 5 1 rs3765703 3.675872 4.8403127 G T 0.4058 G/G T/T
#> 6 1 rs7367066 3.887191 5.7748481 C T 0.6739 C/C C/CThe function findIBD() conveniently wraps the key steps
of the package:
fitHMM())findSegments())ibdPosteriors())ibd = findIBD(cousinsDemo)
#> Individuals: ID1, ID2
#> Chromosome type: autosomal
#> Input data: genotypes
#> Dropout probs (supplied): ID1 = 0, ID2 = 0
#> Model: 2-state HMM, unilineal relationships
#> Markers: 3915 input, 0 removed
#> ----
#> Fitting HMM parameters...
#> Optimising `k1` and `a` jointly; method: L-BFGS-B
#> k1 = 0.237, a = 7.148, loglik = -7704.393
#> ----
#> Finding IBD segments...
#> 14 segments (total length: 597.21 cM)
#> Calculating IBD posteriors...
#> Analysis complete in 1.4 secsFor details of the different steps, see the documentation of the
individual functions: fitHMM(),
findSegments(), and ibdPosteriors().
To visualise the results we pass the output to
plotIBD(). This plots the posterior probabilities on a
background (grey points) showing the identity-by-state (IBS) status at
each marker, i.e. whether the individuals have 0, 1 or 2 alleles in
common. Inferred IBD regions are shown as red segments at the bottom of
each chromosome panel.
plotIBD(ibd)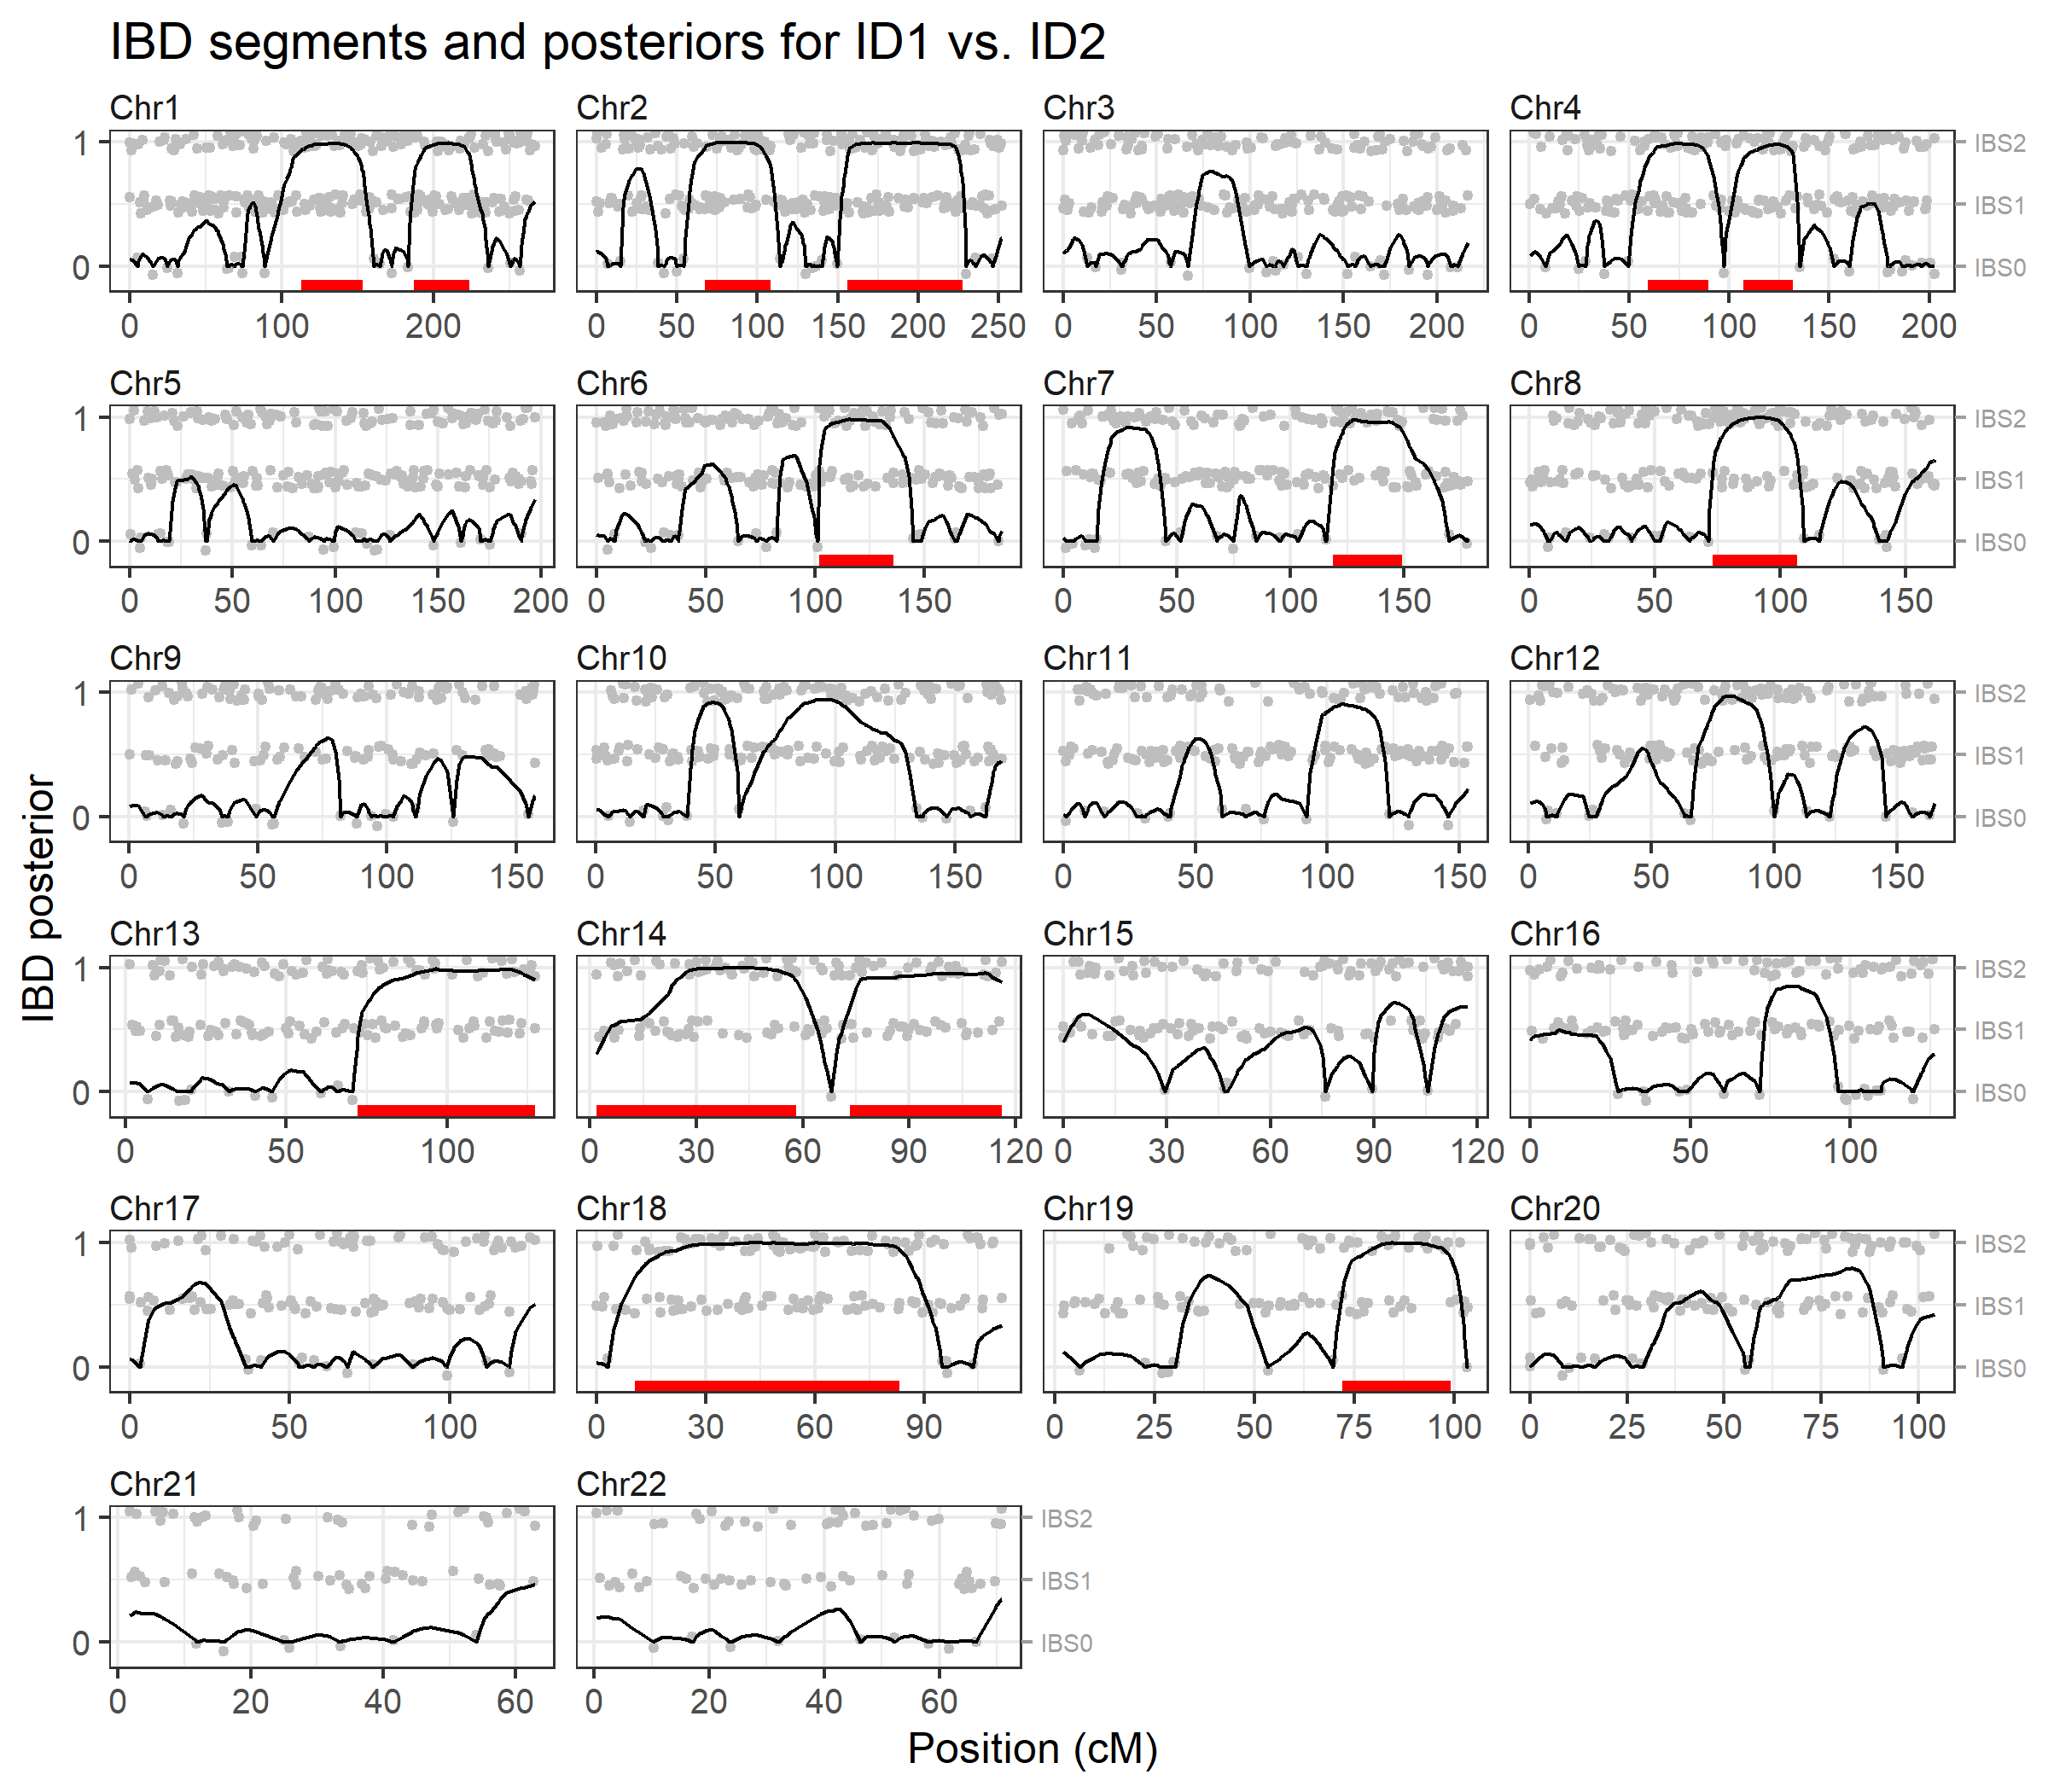
We may also inspect the identified segments as a data frame, showing the start and end positions, and the number of markers in each segment:
ibd$segments
#>    chrom    startCM     endCM   n
#> 1      1 113.000492 153.08623  54
#> 2      1 186.630319 223.39542  46
#> 3      2  67.118524 108.35905  50
#> 4      2 156.120361 227.62362  90
#> 5      4  59.474215  89.85522  41
#> 6      4 106.931772 131.69280  35
#> 7      6 102.041153 136.17734  43
#> 8      7 118.702115 149.11283  38
#> 9      8  72.976430 106.82971  55
#> 10    13  72.049460 127.22724  63
#> 11    14   1.808552  58.07117  67
#> 12    14  73.201009 116.00254  49
#> 13    18  10.592411  83.28443 101
#> 14 19 72.014020 99.15558 34ibdfindr also supports a HMM tailored for full
siblings, with three IBD states 0, 1 and 2. If we apply this to
cousinsDemo it (correctly) reports no IBD2 segments, and in
fact recovers most of the IBD1 segments.
ibdFS = findIBD(cousinsDemo, model = "fullsib")
#> Individuals: ID1, ID2
#> Chromosome type: autosomal
#> Input data: genotypes
#> Dropout probs (supplied): ID1 = 0, ID2 = 0
#> Model: 3-state HMM for full siblings
#> Markers: 3915 input, 0 removed
#> ----
#> Fitting full-sib HMM ...
#>   Optimising `a` conditional on kappa
#>   a = 1.402, loglik = -7750.889
#> ----
#> Finding IBD segments...
#>   IBD0: 31 segments (2798.14 cM, 83.2%)
#>   IBD1: 12 segments (563.93 cM, 16.8%)
#>   IBD2: 0 segments (0.00 cM, 0.0%)
#> Calculating IBD posteriors...
#> Analysis complete in 1.26 secs
Note that the likelihood reported for this model (loglik = -7750.889) is lower here than in the previous analysis (loglik = -7704.393), indicating that the full-sibling model is a worse fit to the data.
The brothersX dataset contains genotypes for two
brothers typed with 246 X-chromosomal SNPs. The analysis below indicates
that they share 3 IBD segments on the X chromosome.
ibdX = findIBD(brothersX)
#> Individuals: ID1, ID2
#> Chromosome type: X (male, male)
#> Input data: genotypes
#> Dropout probs (supplied): ID1 = 0, ID2 = 0
#> Model: 2-state HMM, unilineal relationships
#> Markers: 246 input, 0 removed
#> ----
#> Fitting HMM parameters...
#> Optimising `k1` and `a` jointly; method: L-BFGS-B
#> k1 = 0.502, a = 6.711, loglik = -252.077
#> ----
#> Finding IBD segments...
#> 3 segments (total length: 88.05 cM)
#> Calculating IBD posteriors...
#> Analysis complete in 0.257 secs
plotIBD(ibdX)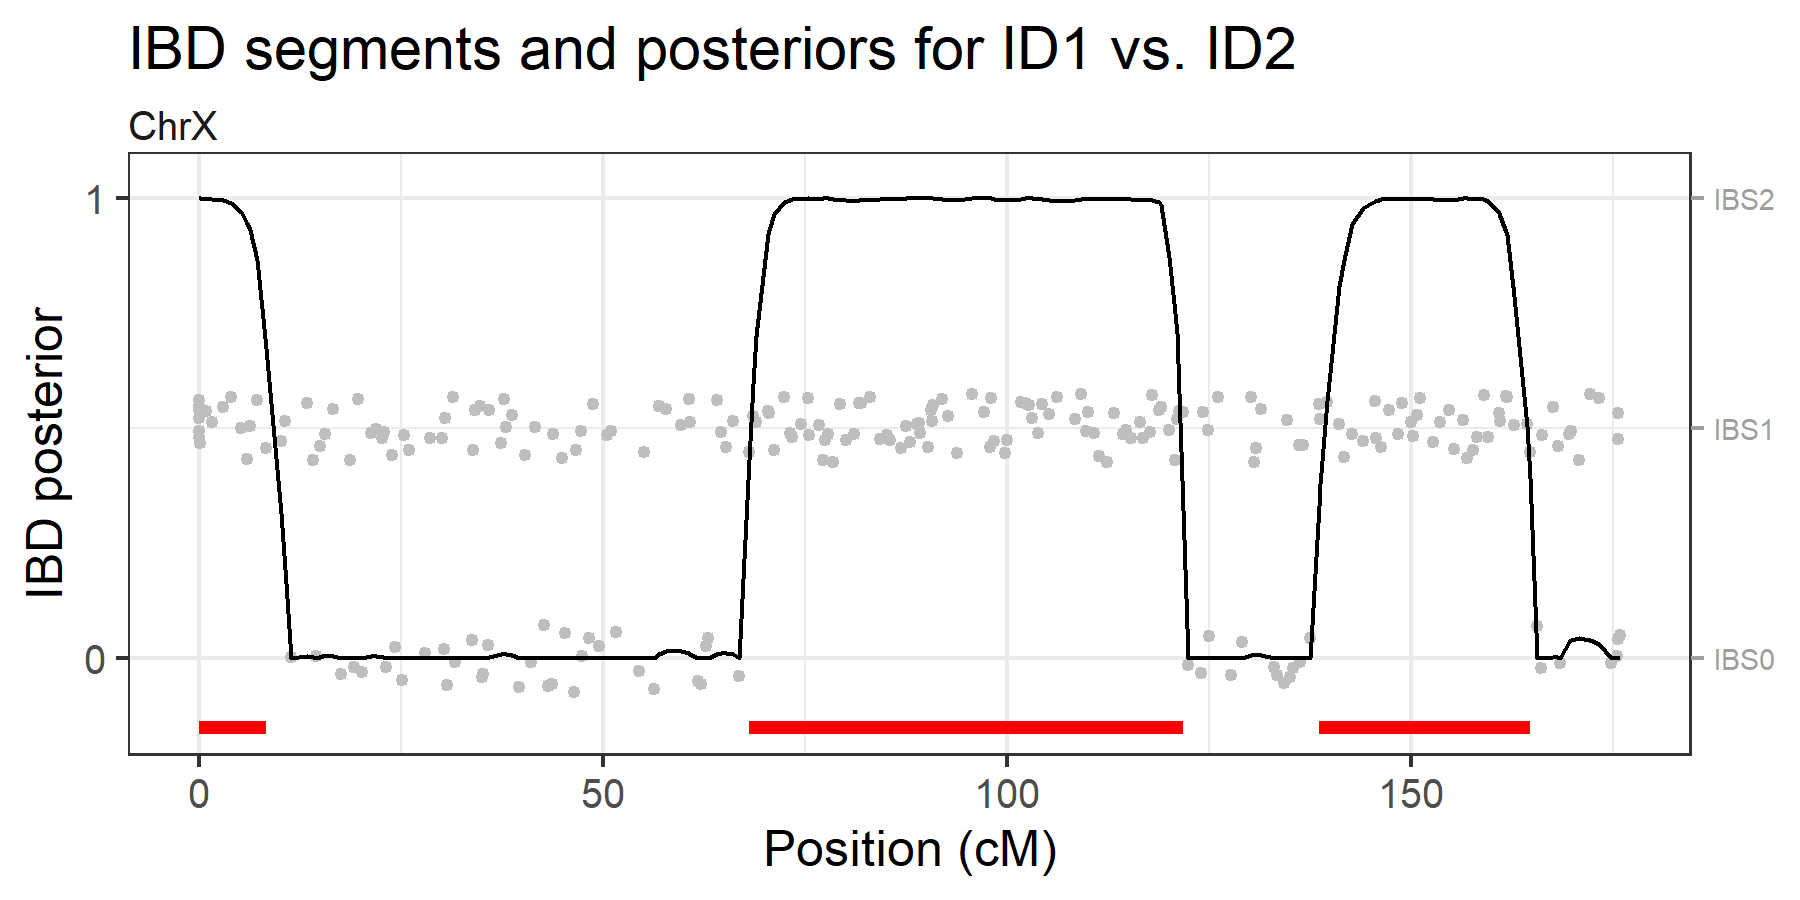 Note that the “fullsib” model is not appropriate in this example, even
if the individuals are full brothers, since the X chromosome is
inherited unilineally in males.
Note that the “fullsib” model is not appropriate in this example, even
if the individuals are full brothers, since the X chromosome is
inherited unilineally in males.
In addition to standard genotype data, ibdfindr also
supports genotype likelihoods (GLs), as typically obtained from low-pass
sequencing data. To exemplify this, we use the built-in dataset
sibsGL containing simulated genotype likelihoods for two
full siblings. The data for each sibling is given in a data frame,
containing base read counts, coverage and genotype likelihoods
(AA, AC, …, TT). Here are the
first three markers for the first sample:
head(sibsGL$data[[1]], 3)
#>       MARKER CHROM     POS A C G T Coverage           AA           AC
#> 1  rs9442372     1 1083324 4 0 7 0       11 9.682262e-15 6.133327e-16
#> 2  rs4648727     1 1844830 1 1 0 0        2 1.337778e-02 1.000000e+00
#> 3 rs10910082     1 2487496 0 0 0 6        6 1.457006e-15 1.457006e-15
#>             AG           AT           CC           CG           CT           GG
#> 1 1.000000e+00 6.133327e-16 1.244374e-24 2.028873e-09 1.244374e-24 2.536566e-07
#> 2 6.711409e-03 6.711409e-03 1.337778e-02 6.711409e-03 6.711409e-03 4.504302e-05
#> 3 1.457006e-15 1.594333e-02 1.457006e-15 1.457006e-15 1.594333e-02 1.457006e-15
#>             GT           TT
#> 1 2.028873e-09 1.244374e-24
#> 2 4.504302e-05 4.504302e-05
#> 3 1.594333e-02 1.000000e+00
(Note that the GLs for each marker are scaled so that the maximum value is 1. This is not a requisite; the values are rescaled internally as part of the processing.)
We first prepare the data with readGL(). This function
accepts either a list of data frames, or a vector of filenames. The SNP
annotation is provided in sibsGL$annot.
gl = readGL(sibsGL$data, sibsGL$annot)We then call findIBD() with the "GL" input
type and the "fullsib" model. The output can be visualised
with plotIBD().
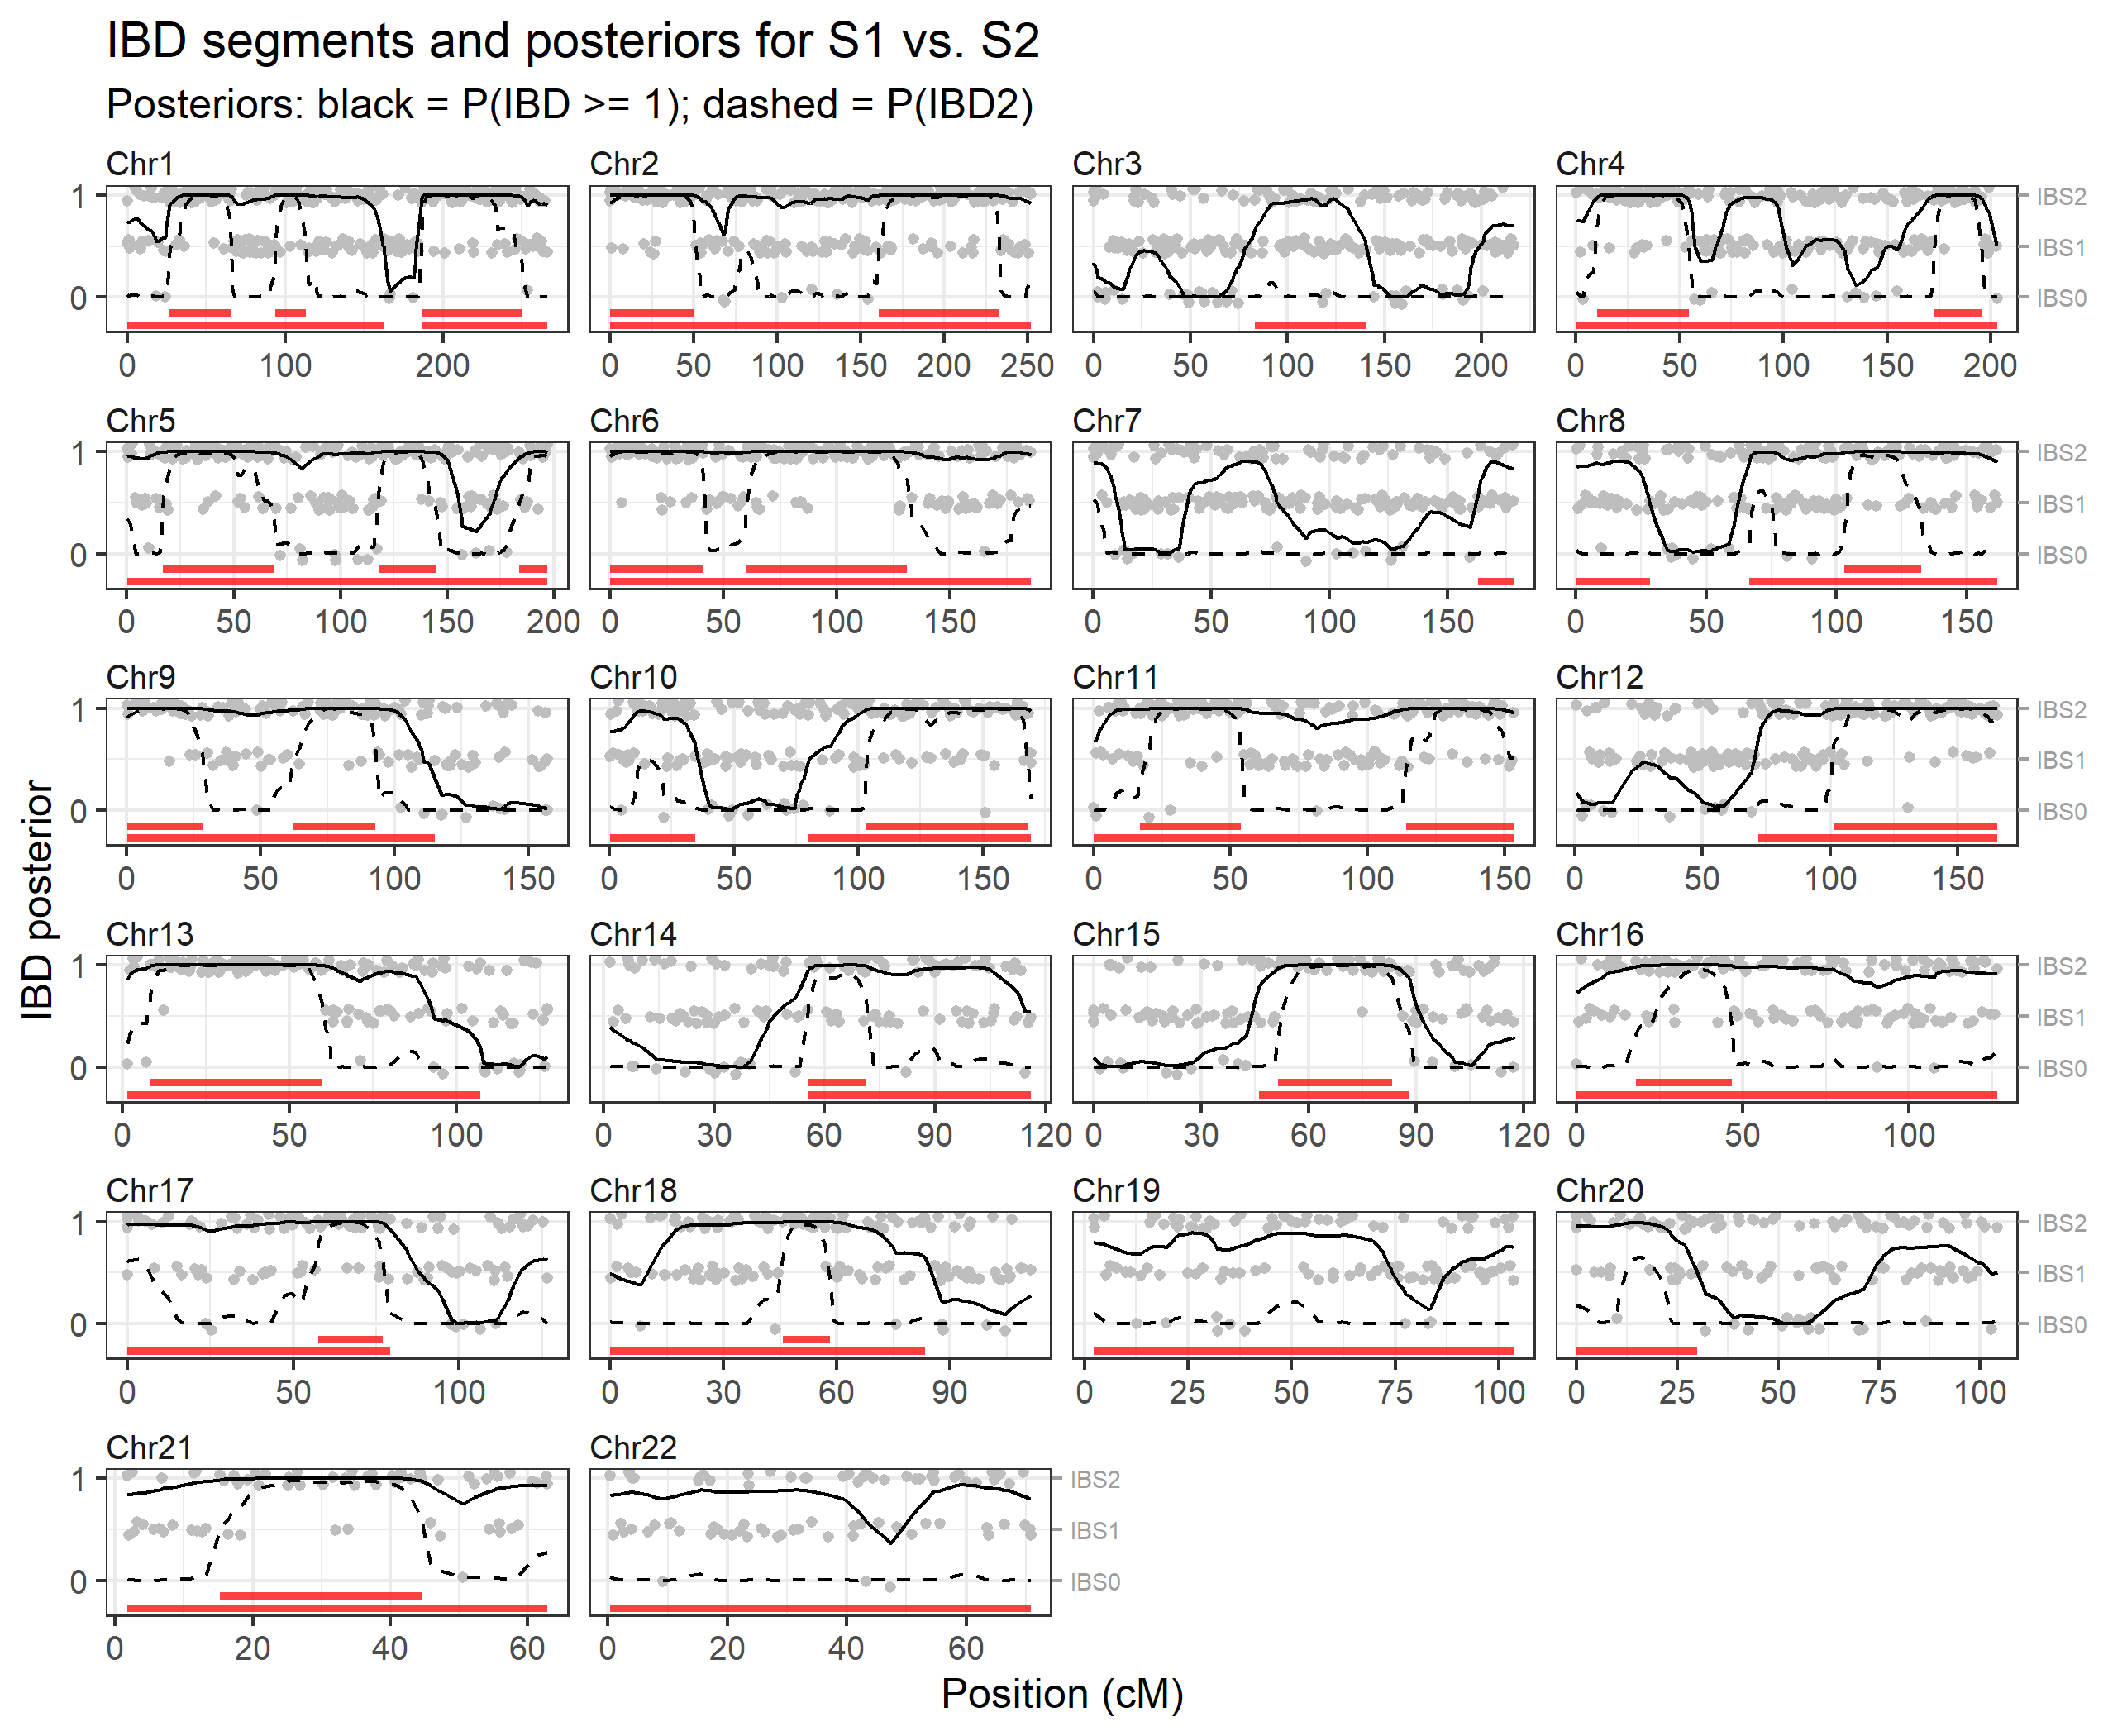
ibdSibs = findIBD(gl, input = "GL", model = "fullsib")
#> Individuals: S1, S2
#> Chromosome type: autosomal
#> Input data: genotype likelihoods
#> Model: 3-state HMM for full siblings
#> Markers: 3930 input, 66 removed, 3864 used
#> Removed markers (categories may overlap):
#>   66 with missing data (S1: 37, S2: 29)
#> ----
#> Fitting full-sib HMM ...
#>   Optimising `a` conditional on kappa
#>   a = 4.148, loglik = -6630.766
#> ----
#> Finding IBD segments...
#>   IBD0: 15 segments (841.79 cM, 25.0%)
#>   IBD1: 43 segments (1521.14 cM, 45.2%)
#>   IBD2: 26 segments (999.14 cM, 29.7%)
#> Calculating IBD posteriors...
#> Analysis complete in 0.462 secsplotIBD(ibdSibs)