| Type: | Package |
| Title: | Wrapper Functions for Producing Graphics |
| Version: | 1.0.0 |
| Author: | Richard Wen <rrwen.dev@gmail.com> |
| Maintainer: | Richard Wen <rrwen.dev@gmail.com> |
| Description: | A set of user-friendly wrapper functions for creating consistent graphics and diagrams with lines, common shapes, text, and page settings. Compatible with and based on the R 'grid' package. |
| Imports: | grDevices, grid, tools |
| License: | MIT + file LICENSE |
| Encoding: | UTF-8 |
| LazyData: | true |
| RoxygenNote: | 6.0.1 |
| URL: | https://github.com/rrwen/draw |
| BugReports: | https://github.com/rrwen/draw/issues |
| NeedsCompilation: | no |
| Packaged: | 2018-07-24 22:07:42 UTC; Rich |
| Repository: | CRAN |
| Date/Publication: | 2018-07-30 11:10:06 UTC |
Draw a Box on the Page
Description
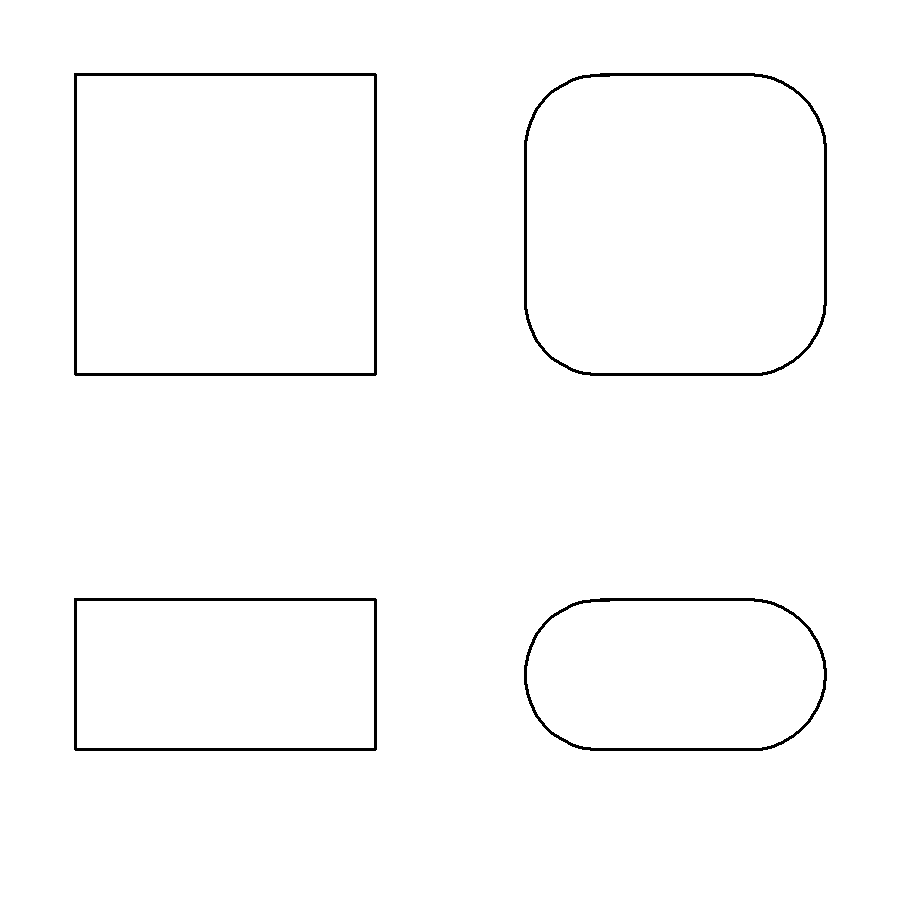
Draws a box on the page given positioning, dimensions and styling.
Usage
drawBox(x, y, width = .pkgenv$boxWidth, height = .pkgenv$boxHeight,
  radius = .pkgenv$boxRadius, fillColor = .pkgenv$boxFillColor,
  opacity = .pkgenv$boxOpacity, lineColor = .pkgenv$boxLineColor,
  lineWidth = .pkgenv$boxLineWidth, lineType = .pkgenv$boxLineType,
  units = .pkgenv$units, ...)
Arguments
x |
Numeric value for the x-axis position of the center. |
y |
Numeric value for the y-axis position of the center. |
width |
Numeric value for the width. |
height |
Numeric value for the height. |
radius |
Numeric value for the radius to create rounded box corners. |
fillColor |
Character value for the fill color. |
opacity |
Numeric value for the transparency with values ranging from 0 (transparent) to 1 (non-transparent). |
lineColor |
Character value for the color of the lines. |
lineWidth |
Numeric value for the width of the lines. |
lineType |
Character value for the line type. One of "blank", "solid", "dashed", "dotted", "dotdash", "longdash", or "twodash" (see "lty" in par). |
units |
Character value for the unit to use when specifying measurements. |
... |
Additional arguments passed to grid.rect. |
Value
See Also
Examples
library(draw)

# Set drawing settings
drawSettings(pageWidth = 5, pageHeight = 5, units = "inches")

# Create a new drawing page
drawPage()

# Draw a square
drawBox(x = 1, y = 4, width = 1, height = 1)

# Draw a square with rounded corners
drawBox(x = 4, y = 4, width = 1, height = 1, radius = 0.25)

# Draw a rectangle
drawBox(x = 1, y = 1, width = 1, height = 0.5)

# Draw a rectangle with rounded corners
drawBox(x = 4, y = 1, width = 1, height = 0.5, radius = 0.25)

# Export the drawing page to a PDF
drawExport("drawBox.pdf")
Draw a Circle on the Page
Description
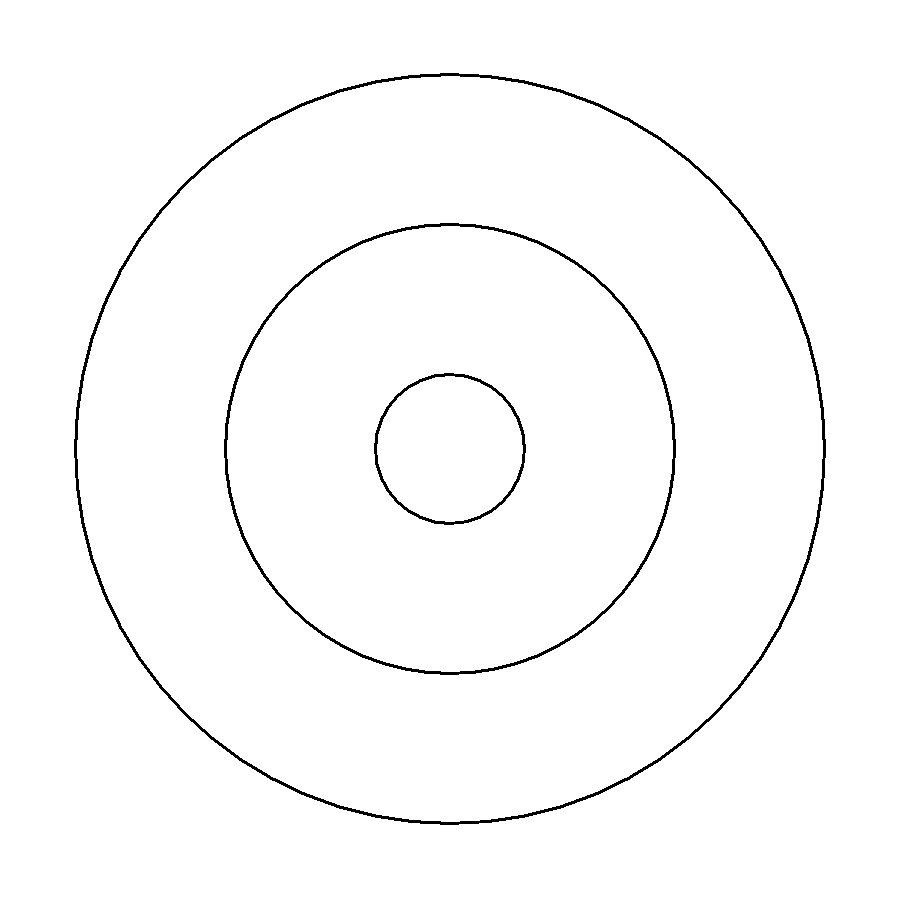
Draws a circle on the page given positioning, dimensions and styling.
Usage
drawCircle(x, y, radius = .pkgenv$circleRadius,
  fillColor = .pkgenv$circleFillColor, opacity = .pkgenv$circleOpacity,
  lineColor = .pkgenv$circleLineColor, lineWidth = .pkgenv$circleLineWidth,
  lineType = .pkgenv$circleLineType, units = .pkgenv$units, ...)
Arguments
x |
Numeric value for the x-axis position of the center. |
y |
Numeric value for the y-axis position of the center. |
radius |
Numeric value for radius of the circle. |
fillColor |
Character value for the fill color. |
opacity |
Numeric value for the transparency with values ranging from 0 (transparent) to 1 (non-transparent). |
lineColor |
Character value for the color of the lines. |
lineWidth |
Numeric value for the width of the lines. |
lineType |
Character value for the line type. One of "blank", "solid", "dashed", "dotted", "dotdash", "longdash", or "twodash" (see "lty" in par). |
units |
Character value for the unit to use when specifying measurements. |
... |
Additional arguments passed to grid.circle |
Value
A grid.circle grob object.
See Also
Examples
library(draw)

# Set drawing settings
drawSettings(pageWidth = 5, pageHeight = 5, units = "inches")

# Create a new drawing page
drawPage()

# Draw a small circle
drawCircle(x = 2.5, y = 2.5, radius = 0.5)

# Draw a mid sized circle
drawCircle(x = 2.5, y = 2.5, radius = 1)

# Draw a large circle
drawCircle(x = 2.5, y = 2.5, radius = 2)

# Export the drawing page to a PDF
drawExport("drawCircle.pdf")
Draw a Curve on the Page
Description
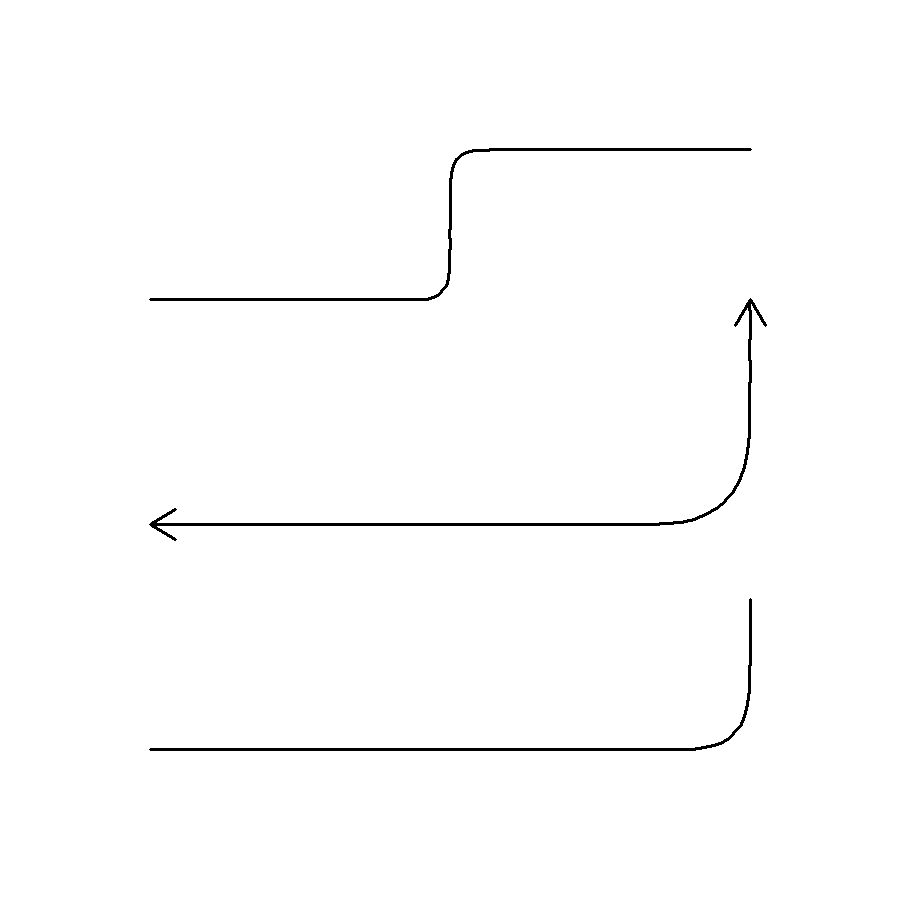
Draws a curve on the page given positioning, dimensions and styling.
Usage
drawCurve(x, y, curvature = .pkgenv$curveCurvature,
  angle = .pkgenv$curveAngle, points = .pkgenv$curvePoints,
  shape = .pkgenv$curveShape, square = .pkgenv$curveSquare,
  squareShape = .pkgenv$curveSquareShape, opacity = .pkgenv$curveOpacity,
  lineColor = .pkgenv$curveLineColor, lineWidth = .pkgenv$curveLineWidth,
  lineType = .pkgenv$curveLineType, inflect = .pkgenv$curveInflect,
  open = .pkgenv$curveOpen, arrowAngle = .pkgenv$arrowAngle,
  arrowLength = .pkgenv$arrowLength, arrowUnits = .pkgenv$arrowUnits,
  arrowEnds = .pkgenv$arrowEnds, arrowType = .pkgenv$arrowType,
  units = .pkgenv$units, ...)
Arguments
x |
Numeric vector of length 2 for x-axis position of starting and ending points. |
y |
Numeric vector of length 2 for y-axis position of starting and ending points. |
curvature |
Numeric value for the curvature of the curve. Values of 0 create a straight line, negative values create left-hand curves, and positive values create right-hand curves. |
angle |
Numeric value of the curve control point skewness ranging from 0 to 180. Values less than 90 skew towards the start point, and values more than 90 skew towards the end point. |
points |
Numeric value for the number of curve control points with higher numbers creating a smoother curve. |
shape |
Numeric value for the shape of the curve ranging from -1 to 1 (See grid.xspline). |
square |
Logical value indicating whether curve control points are created in a city-block or oblique way. It is recommended to set this to TRUE if points is 1 and angle is 90, and FALSE otherwise (see grid.curve). |
squareShape |
Numeric value controlling curve behaviours relative to control points. Applies if square is TRUE. |
opacity |
Numeric value for the transparency with values ranging from 0 (transparent) to 1 (non-transparent). |
lineColor |
Character value for the color of the lines. |
lineWidth |
Numeric value for the width of the lines. |
lineType |
Character value for the line type. One of "blank", "solid", "dashed", "dotted", "dotdash", "longdash", or "twodash" (see "lty" in par). |
inflect |
Logical value indicating if the curve should be cut in half and inverted (TRUE) or not (FALSE). |
open |
Logical value indicating whether to open the curve (TRUE) or close the curve (FALSE). |
arrowAngle |
Numeric value of the angle for arrows. Smaller numbers create narrower arrows, and larger numbers produce wider arrows. |
arrowLength |
Numeric value of the length for arrows. |
arrowUnits |
Character value of the measurement unit for arrows. |
arrowEnds |
Character value indicating which end to draw arrows on lines. Must be one of "last", "first" or "both". |
arrowType |
Character value indicating if the arrow heads should be closed or open. Must be one of "open" or "closed". |
units |
Character value for the unit to use when specifying measurements. |
... |
Additional arguments passed to grid.curve. |
Value
A grid.curve grob object.
See Also
Examples
library(draw)

# Set drawing settings
drawSettings(pageWidth = 5, pageHeight = 5, units = "inches")

# Create a new drawing page
drawPage()

# Draw a curved angle
drawCurve(x = c(1, 4),
          y = c(1, 2),
          angle = 90)

# Draw a curved angle with arrows
drawCurve(x = c(1, 4),
          y = c(2, 3.75),
          angle = 90, arrowLength = 0.1, arrowEnd = "both")

# Draw an inflected curve
drawCurve(x = c(1, 4),
          y = c(3, 4),
          angle = 90, inflect = TRUE)

# Export the drawing page to a PDF
drawExport("drawCurve.pdf")
Export Current Drawing Page to a File
Description
Export Current Drawing Page to a File
Usage
drawExport(f, width = .pkgenv$pageWidth, height = .pkgenv$pageHeight,
  ppi = .pkgenv$exportPPI, format = tools::file_ext(f),
  textSize = .pkgenv$textSize, units = .pkgenv$exportUnits, ...)
Arguments
f |
Character value of the file path to save to. Must include file name and extension. |
width |
Numeric value of the image width. |
height |
Numeric value of the image height. |
ppi |
Numeric value of the image resolution quality in Pixels Per Inch (PPI). |
format |
Character value of the extension for file without a period ".". |
textSize |
Size of text (pt) in image. |
units |
Character value for the unit to use when specifying measurements. Can be one of the following:
|
... |
Additional arguments passed to dev.copy. |
Value
The name and number of the device, according to dev.copy, which has been copied to.
See Also
Examples
library(draw)

# Set drawing settings
drawSettings(pageWidth = 5, pageHeight = 5, units = "inches")

# Create a new drawing page
drawPage()

# Draw a square
drawBox(x = 1, y = 4, width = 2, height = 2)

# Export the drawing page to a PDF
drawExport("export.pdf")

# Export the drawing page to a PNG
drawExport("export.png", ppi=300)
Draw a Line on the Page
Description
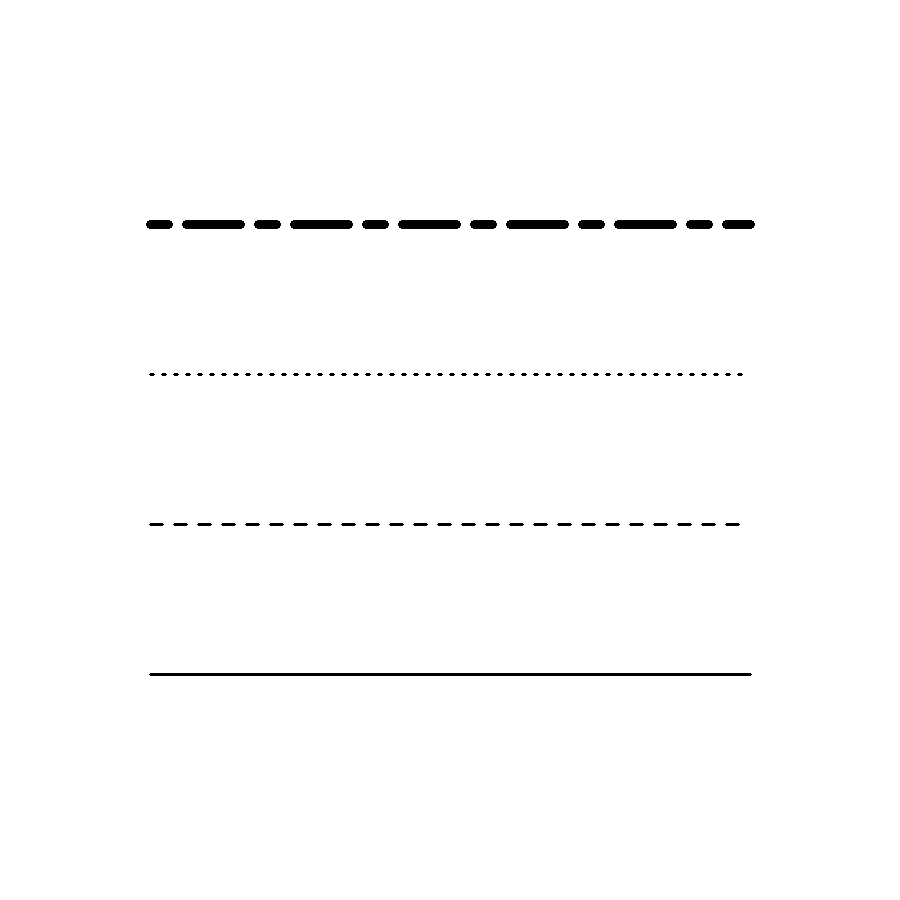
Draws a line on the page given positioning, dimensions and styling.
Usage
drawLine(x, y, opacity = .pkgenv$lineOpacity, lineColor = .pkgenv$lineColor,
  lineWidth = .pkgenv$lineWidth, lineType = .pkgenv$lineType,
  arrowAngle = .pkgenv$arrowAngle, arrowLength = .pkgenv$arrowLength,
  arrowUnits = .pkgenv$arrowUnits, arrowEnds = .pkgenv$arrowEnds,
  arrowType = .pkgenv$arrowType, units = .pkgenv$units, ...)
Arguments
x |
Numeric vector for the x-axis positions of the control points. |
y |
Numeric vector for the y-axis positions of the control points. |
opacity |
Numeric value for the transparency with values ranging from 0 (transparent) to 1 (non-transparent). |
lineColor |
Character value for the color of the lines. |
lineWidth |
Numeric value for the width of the lines. |
lineType |
Character value for the line type. One of "blank", "solid", "dashed", "dotted", "dotdash", "longdash", or "twodash" (see "lty" in par). |
arrowAngle |
Numeric value of the angle for arrows. Smaller numbers create narrower arrows, and larger numbers produce wider arrows. |
arrowLength |
Numeric value of the length for arrows. |
arrowUnits |
Character value of the measurement unit for arrows. |
arrowEnds |
Character value indicating which end to draw arrows on lines. Must be one of "last", "first" or "both". |
arrowType |
Character value indicating if the arrow heads should be closed or open. Must be one of "open" or "closed". |
units |
Character value for the unit to use when specifying measurements. |
... |
Additional arguments passed to grid.lines. |
Value
A grid.lines grob object.
See Also
Examples
library(draw)

# Set drawing settings
drawSettings(pageWidth = 5, pageHeight = 5, units = "inches")

# Create a new drawing page
drawPage()

# Draw a solid line
drawLine(x = c(1, 4),
         y = c(1 ,1))

# Draw a dashed line
drawLine(x = c(1, 4),
         y = c(2 ,2),
         lineType = "dashed")

# Draw a dotted line with ending arrow
drawLine(x = c(1, 4),
         y = c(3 ,3),
         lineType = "dotted", arrowEnds = "last")

# Draw thick two dash line with starting arrow
drawLine(x = c(1, 4),
         y = c(4, 4),
         lineWidth = 3, lineType = "twodash", arrowEnds = "first")

# Export the drawing page to a PDF
drawExport("drawLine.pdf")
Create a New Drawing Page
Description
Create a New Drawing Page
Usage
drawPage(width = .pkgenv$pageWidth, height = .pkgenv$pageHeight,
  units = .pkgenv$units, ...)
Arguments
width |
Numeric value for the page width. |
height |
Numeric value for the page height. |
units |
Character value for the unit to use when specifying measurements. |
... |
Additional arguments to viewport. |
Value
A viewport object.
See Also
Examples
library(draw)

# Set drawing settings
drawSettings(pageWidth = 5, pageHeight = 5, units = "inches")

# Create a new drawing page
drawPage()
Draw a Point on the Page
Description
Draws a point on the page given positioning, dimensions and styling.
Usage
drawPoint(x, y, pch = .pkgenv$pointPCH, size = .pkgenv$pointSize,
  fillColor = .pkgenv$pointFillColor, opacity = .pkgenv$pointOpacity,
  lineColor = .pkgenv$pointLineColor, lineWidth = .pkgenv$pointLineWidth,
  lineType = .pkgenv$pointLineType, units = .pkgenv$units, ...)
Arguments
x |
Numeric value for the x-axis position of the center. |
y |
Numeric value for the y-axis position of the center. |
pch |
Numeric value indicating which plotting symbol to use (see points). Some examples include 0 for square, 1 for circle, 2 for triangle, and 4 for X. |
size |
Numeric value for the size of the point. |
fillColor |
Character value for the fill color. |
opacity |
Numeric value for the transparency with values ranging from 0 (transparent) to 1 (non-transparent). |
lineColor |
Character value for the color of the lines. |
lineWidth |
Numeric value for the width of the lines. |
lineType |
Character value for the line type. One of "blank", "solid", "dashed", "dotted", "dotdash", "longdash", or "twodash" (see "lty" in par). |
units |
Character value for the unit to use when specifying measurements. |
... |
Additional arguments passed to grid.points. |
Value
A grid.points grob object.
See Also
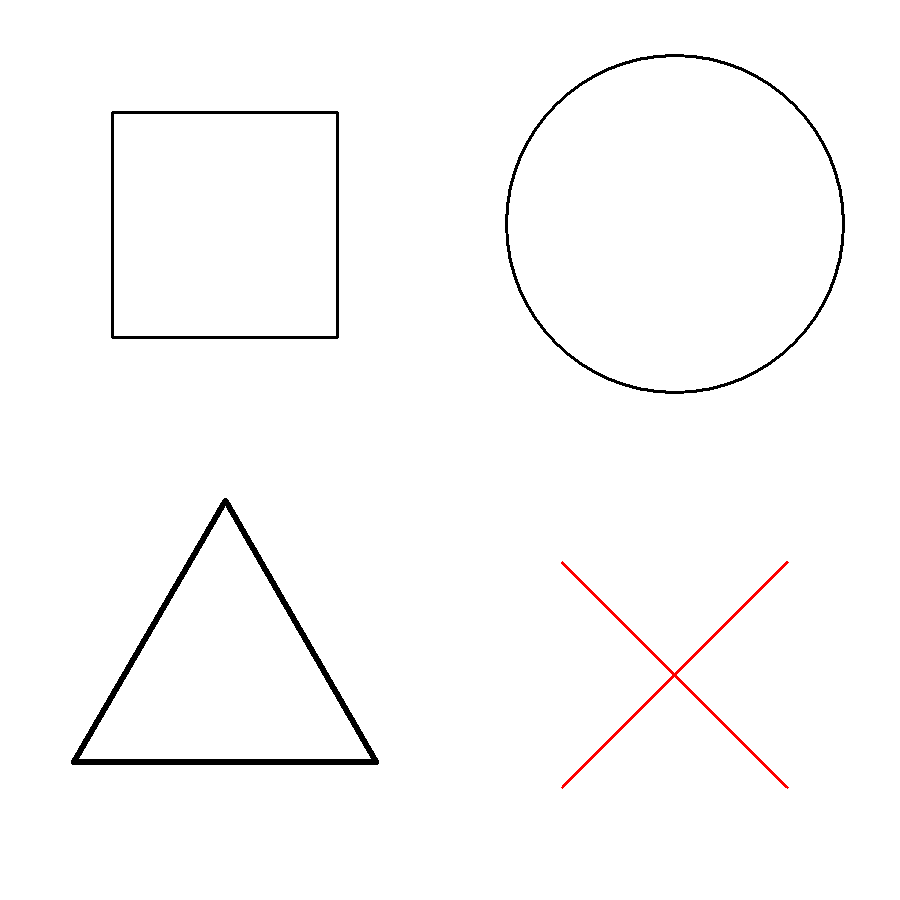
Examples
library(draw)

# Set drawing settings
drawSettings(pageWidth = 5, pageHeight = 5, units = "inches")

# Create a new drawing page
drawPage()

# Draw a square point
drawPoint(x = 1, y = 4, pch = 0)

# Draw a larger circle point
drawPoint(x = 4, y = 4, pch = 1, size = 1.5)

# Draw a triangle point
drawPoint(x = 1, y = 1, pch = 2, lineWidth = 2)

# Draw a red X point
drawPoint(x = 4, y = 1, pch = 4, lineColor = "red")

# Export the drawing page to a PDF
drawExport("drawPoint.pdf")
Modify Default Drawing Settings
Description
Modify Default Drawing Settings
Usage
drawSettings(...)
Arguments
... |
Default settings to modify draw package settings stored in an environment. |
Details
The following parameters are available to change:
*
-
units [default = "inches"]: Character value of default measurement unit for applicable draw function parameters (such as width, height, radius, x, y, etc).
-
arrowAngle [default = 30]: Numeric value of the angle for arrows. Smaller numbers create narrower arrows, and larger numbers produce wider arrows.
-
arrowLength [default = 0]: Numeric value of the length for arrows.
-
arrowUnits [default = units]: Character value of the measurement unit for arrows. Default is the same as units parameter under *.
-
arrowEnds [default = "last"]: Character value indicating which end to draw arrows on lines. Must be one of "last", "first" or "both".
-
arrowType [default = "open"]: Character value indicating if the arrow heads should be closed or open. Must be one of "open" or "closed".
-
boxWidth [default = 1]: Numeric value of the width for boxes.
-
boxHeight [default = 1]: Numeric value of the height for boxes.
-
boxRadius [default = 0]: Numeric value of the radius for boxes to create rounded corners.
-
boxFillColor [default = "transparent"]: Character value of the color to fill boxes with.
-
boxOpacity [default = 1]: Numeric value of transparency for boxes ranging from 0 (transparent) to 1 (non-transparent).
-
boxLineWidth [default = 1]: Numeric value of the width for the box lines.
-
boxLineType [default = "solid"]: Character value of the type of line for the boxes. One of "blank", "solid", "dashed", "dotted", "dotdash", "longdash", or "twodash" (see "lty" in par).
-
boxLineColor [default = "black"]: Character value of the color for the box lines.
-
circleRadius [default = 0.5]: Numeric value of the radius for circles.
-
circleFillColor [default = "transparent"]: Character value of the color to fill circles with.
-
circleOpacity [default = 1]: Numeric value of the transparency for circles ranging from 0 (transparent) to 1 (non-transparent).
-
circleLineWidth [default = 1]: Numeric value of the width for the circle lines.
-
circleLineType [default = "solid"]: Character value of the type of line for the circles. One of "blank", "solid", "dashed", "dotted", "dotdash", "longdash", or "twodash" (see "lty" in par).
-
circleLineColor [default = "black"]: Character value of the color for the circle lines.
-
curveCurvature [default = 1]: Numeric value of the curvature for the curves. Values of 0 create a straight line, negative values create left-hand curves, and positive values create right-hand curves.
-
curveAngle [default = 90]: Numeric value of the curve control point skewness ranging from 0 to 180. Values less than 90 skew towards the start point, and values more than 90 skew towards the end point.
-
curvePoints [default = 1]: Numeric value of the number of control points for the curves, where higher values create smoother curves.
-
curveShape [default = 0.5]: Numeric value of the shape for the curves ranging from -1 to 1 (See grid.xspline).
-
curveSquare [default = TRUE]: Logical value indicating whether curve control points are created in a city-block or oblique way. It is recommended to set this to TRUE if curvePoints is 1 and curveAngle is 90, and FALSE otherwise (see grid.curve).
-
curveSquareShape [default = 1]: Numeric value controlling curve behaviours relative to control points. Applies if curveSquare is TRUE.
-
curveOpacity [default = 1]: Numeric value of the transparency for the curves ranging from 0 (transparent) to 1 (non-transparent).
-
curveLineColor [default = "black"]: Character value of the color for the curve lines.
-
curveLineWidth [default = 1]: Character value of the width for the curve lines.
-
curveLineType [default = "solid"]: Character value of the type of line for the curves. One of "blank", "solid", "dashed", "dotted", "dotdash", "longdash", or "twodash" (see "lty" in par).
-
curveInflect [default = FALSE]: Logical value indicating if curve should be cut in half and inverted (TRUE) or not (FALSE).
-
curveOpen [default = TRUE]: Logical value indicating whether to open the curves (TRUE) or close the curves (FALSE).
-
exportUnits [default = units]: Character value of measurement unit for exporting. Default is the same as units parameter under *.
-
exportPPI [default = 150]: Numeric value of the image quality measured in Pixels Per Inch (PPI).
-
lineOpacity [default = 1]: Numeric value of the transparency of the lines ranging from 0 (transparent) to 1 (non-transparent).
-
lineWidth [default = 1]: Numeric value of the width of the lines.
-
lineType [default = "solid"]: Character value of the type for the lines. One of "blank", "solid", "dashed", "dotted", "dotdash", "longdash", or "twodash" (see "lty" in par).
-
lineColor [default = "black"]: Character value of the color of the lines.
-
pageWidth [default = 8.5]: Numeric value of the width of the drawing page.
-
pageHeight [default = 11]: Numeric value of the height of the drawing page.
-
pointPCH [default = 20]: Numeric value indicating which plotting symbol to use (see points). Some examples include 0 for square, 1 for circle, 2 for triangle, and 4 for X.
-
pointSize [default = 1]: Numeric value of the point size.
-
pointFillColor [default = "transparent"]: Character value of the color to fill each point.
-
pointOpacity [default = 1]: Numeric value of the transparency for the points ranging from 0 (transparent) to 1 (non-transparent).
-
pointLineColor [default = "black"]: Character value of the color of the points.
-
pointLineType [default = "solid"]: Character value of the type for the lines. One of "blank", "solid", "dashed", "dotted", "dotdash", "longdash", or "twodash" (see "lty" in par).
-
pointLineWidth [default = 1]: Numeric value of the width of the point lines.
-
text [default = "text"]: Character value of the text to display at the defined position.
-
textJust [default = "centre"]: Character value of the text justification. One of "left", "right", "centre", "center", "bottom", or "top".
-
textHjust [default = NULL]: Numeric value of the horizontal justification.
-
textVjust [default = NULL]: Numeric value of the vertical justification.
-
textAngle [default = 0]: Numeric value of the angle to rotate text.
-
textOverlap [default = FALSE]: Logical value indicating if overlapping text should be removed (TRUE) or not (FALSE).
-
textOpacity [default = 1]: Numeric value of the transparency for text ranging from 0 (transparent) to 1 (non-transparent).
-
textColor [default = "black"]: Character value of the color for text.
-
textSize [default = 12]: Numeric value of the text font size in pt.
-
textFace [default = "plain"]: Character value of the text font face. One of "plain", "bold", "italic", "oblique", and "bold.italic" (see fontface in gpar).
-
textFamily [default = "sans"]: Character value of text font family to use (see family in par). Common values are "serif", "sans" and "mono".
-
textLineHeight [default = 1.2]: Numeric value of text line height as a multiple of the size of the text.
Value
A list of the current draw settings with changes.
Examples
library(draw)

# Set page dimensions and units to inches
drawSettings(pageWidth = 5, pageHeight = 5, units = "inches")

# Set export resolution in Pixels Per Inch (PPI)
drawSettings(exportPPI = 300)

# Set default width and height for all boxes in inches
drawSettings(boxWidth = 1, boxHeight = 1)

# Create a new drawing page
drawPage()

# Draw default 1 by 1 inch boxes near the center
drawBox(x = 2, y = 2.5)
drawBox(x = 3, y = 2.5)

# Draw a non-default 2 by 2 inch box in the center
drawBox(x = 2.5, y = 2.5, width = 2, height = 2)

# Export the current drawing page
drawExport("drawSettingsExample.pdf")
Draw Text on the Page
Description
Draws text on the page given positioning, dimensions and styling.
Usage
drawText(x, y, text = .pkgenv$text, just = .pkgenv$textJust,
  hjust = .pkgenv$textHjust, vjust = .pkgenv$textVjust,
  angle = .pkgenv$textAngle, overlap = .pkgenv$textOverlap,
  opacity = .pkgenv$textOpacity, color = .pkgenv$textColor,
  size = .pkgenv$textSize, face = .pkgenv$textFace,
  family = .pkgenv$textFamily, lineHeight = .pkgenv$textLineHeight,
  units = .pkgenv$units, ...)
Arguments
x |
Numeric value for the x-axis position of the center. |
y |
Numeric value for the y-axis position of the center. |
text |
Character value of the text to display at xy position. |
just |
Character value of the text justification. One of "left", "right", "centre", "center", "bottom", or "top". |
hjust |
Numeric value of the horizontal justification. |
vjust |
Numeric value of the vertical justification. |
angle |
Numeric value of the angle to rotate text. |
overlap |
Logical value indicating if overlapping text should be removed (TRUE) or not (FALSE). |
opacity |
Numeric value of the transparency for text ranging from 0 (transparent) to 1 (non-transparent). |
color |
Character value of the color for text. |
size |
Numeric value of the text font size in pt. |
face |
Character value of the text font face. One of "plain", "bold", "italic", "oblique", and "bold.italic" (see fontface in gpar). |
family |
Character value of text font family to use (see family in par). Common values are "serif", "sans" and "mono". |
lineHeight |
Numeric value of text line height as a multiple of the size of the text. |
units |
Character value for the unit to use when specifying measurements. |
... |
Additional arguments passed to grid.text. |
Value
See Also
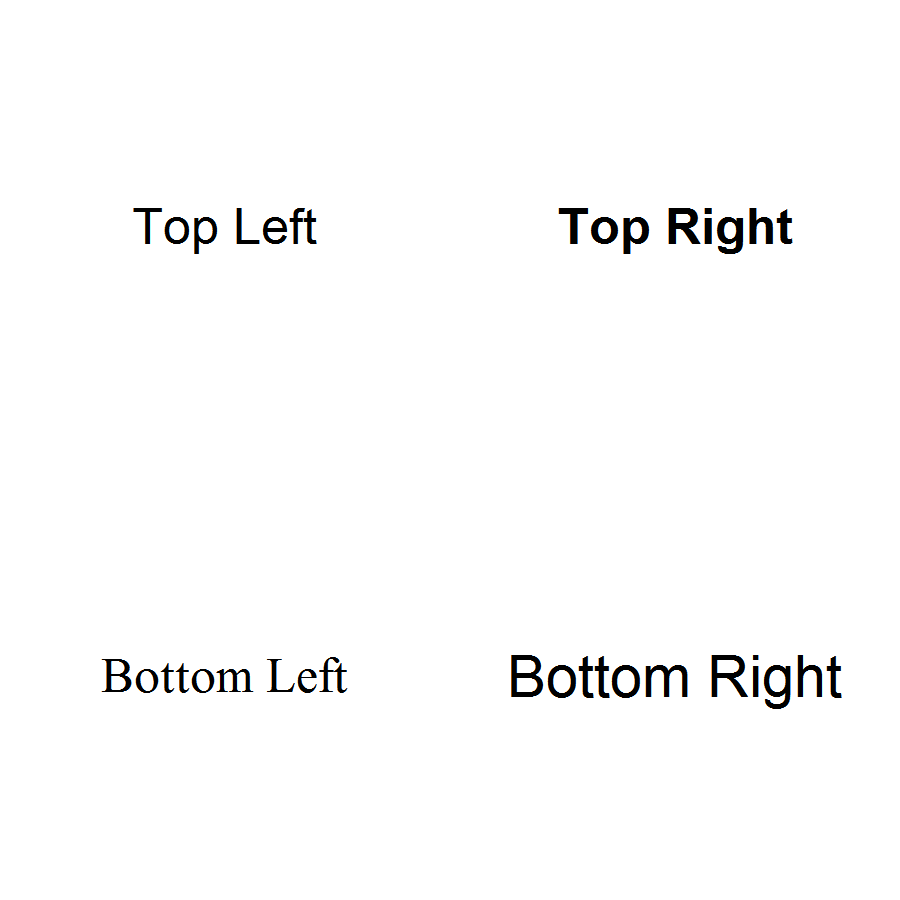
Examples
library(draw)

# Set drawing settings
drawSettings(pageWidth = 5, pageHeight = 5, units = "inches")

# Create a new drawing page
drawPage()

# Draw text on top left corner
drawText(x = 1, y = 4, text = "Top Left")

# Draw bold text on top right corner
drawText(x = 4, y = 4, text = "Top Right", face = "bold")

# Draw serif text on bottom left corner
drawText(x = 1, y = 1, text = "Bottom Left", family = "serif")

# Draw larger text on bottom right corner
drawText(x = 4, y = 1, text = "Bottom Right", size = 14)

# Export the drawing page to a PDF
drawExport("drawText.pdf")